Visitors / Employees


Labor Market Report for September 11th, 2020
Every week, we will be publishing labor market industry (LMI) data and important trends to consider in the development of an equitable economic recovery from the COVID-19 crisis. We are always looking for opportunities to learn, grow, and collaborate. Email [email protected] to learn more.
“I can always wait tables.” Whether it is frustrated recent college graduate or a musician who needs work when they are not on the road, in normal economic times, jobs serving at restaurants are plentiful and easy to acquire. That does not mean those jobs are easy to do, or pay fairly, but the consistent demand for servers, a diverse set of businesses, and consistent duties across most restaurants make moving in or out of the industry easy for most workers. Since COVID-19 shutdowns began, this all changed. Suddenly, indoor dining was banned, and the demand for servers virtually disappeared. However, another job that features many of the same qualities has weathered COVID quite well.
Over the past several years, demand for nannies/babysitters has closely tracked with the demand for restaurant servers. That trend broke in the spring. Looking at the moving average for postings over the past two years, the volume of nannying job postings has stayed consistently between 120 -160 postings per month, while the number of server job postings fell from an average of around 175 per month down to a low below 50 this summer. It is worth noting that job postings in both occupations may not reflect the total number of jobs, since nannying jobs are often found through personal networks, and restaurants who post “hiring” in their window aren’t captured in the data. We believe it’s safe to extrapolate that informal opportunities are following similar trends.
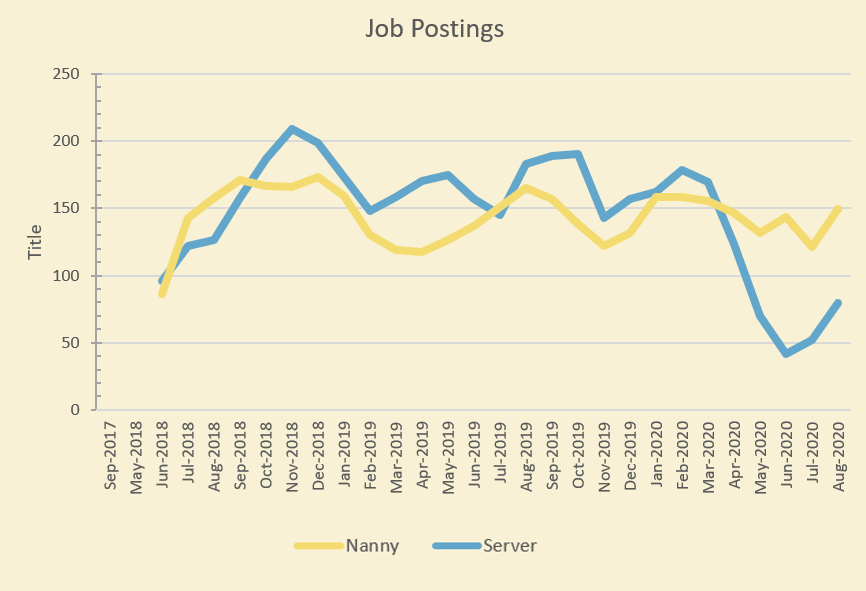
Since demand for nannies has stayed consistent while demand for most jobs has declined, there was a week in June when nannying jobs were the most in-demand occupation across the Philadelphia metro area by number of job postings. With school starting remotely for many families, having someone dedicated to support a child’s needs and learning has become critical, especially in households where all adults are working remotely. Typically, a nanny earns around $14.20 an hour in Philadelphia, which is several dollars an hour higher than the average wage for a server, although server wages vary greatly due to the reliance on unreported tips.
Whenever schools can reopen at full capacity, some of these additional nannying jobs will disappear. Nannies who previously worked in the hospitality industry may find themselves out of work again, facing another tough job market. Will the gradual return of indoor dining help the hospitality industry get re-established and begin its road to recovery? Or will colder weather bring the predicted spike in COVID-19 cases and lead to more shutdowns? We do not have the answer, but we can say that both nannies and restaurant servers face an uncertain job market in the coming year.
As the number of job postings rebound, finding ways to apply general experience through transferrable skills to new roles will be critical when searching for jobs. To pull on the nanny and server examples, hospitality workers may see nannying as a viable option while restaurants and hotels remain closed or at reduced capacity, since skills like customer service, reliability, and flexibility are important skills in both jobs. In the same way, it'll be important for jobseekers to boil their job skills down to their essence so they can be strong candidates for new positions.
|
|
Job Postings, Aug. 30th – Sept. 5th |
Percentage change, since Feb. 15th |
Percentage change since prior week |
|||
|
|
Phila Metro |
Phila City |
Phila Metro |
Phila City |
Phila Metro |
Phila City |
|
Health Care & Social Assistance |
2951 |
837 |
-25% |
-34% |
9% |
-8% |
|
Professional, Scientific & Tech Services |
969 |
390 |
-40% |
-42% |
5% |
-21% |
|
Retail Trade |
2737 |
283 |
73% |
9% |
-50% |
-25% |
|
Finance & Insurance |
923 |
238 |
-36% |
-54% |
-3% |
-4% |
|
Accommodation & Food Service |
968 |
212 |
-12% |
-63% |
36% |
10% |
|
Manufacturing |
1047 |
157 |
-22% |
-33% |
12% |
-8% |
|
Administrative & Support & Waste |
596 |
132 |
-34% |
-42% |
-16% |
-24% |
|
Educational Services |
603 |
251 |
-47% |
-50% |
-25% |
-36% |
|
Transportation & Warehousing |
480 |
125 |
-35% |
-29% |
1% |
-21% |
|
Information |
335 |
100 |
-40% |
-69% |
2% |
-10% |
|
Other Services |
357 |
75 |
-24% |
-1% |
3% |
60% |
|
Public Administration |
227 |
70 |
-17% |
-44% |
-10% |
-27% |
|
Real Estate & Rental Leasing |
291 |
84 |
-13% |
-33% |
10% |
8% |
|
Construction |
203 |
56 |
-9% |
-33% |
-4% |
2% |
|
Arts, Entertainment & Recreation |
136 |
51 |
-7% |
-16% |
32% |
28% |
|
Wholesale Trade |
77 |
2 |
0% |
-80% |
13% |
-82% |
|
Utilities |
32 |
9 |
-35% |
13% |
19% |
200% |
|
Mining, Quarrying and Oil & Gas |
29 |
8 |
-26% |
-27% |
-3% |
-11% |
|
Mgmt of Companies & Enterprises |
26 |
4 |
-41% |
-64% |
53% |
-43% |
|
Agriculture, Forestry, and Hunting |
35 |
6 |
75% |
20% |
119% |
50% |
|
Unspecified |
3546 |
1114 |
-27% |
-36% |
9% |
14% |
|
Total |
16568 |
4204 |
-21% |
-40% |
-11% |
-8% |
About the data: Data is sourced from Burning Glass Technologies Labor Insights, unless otherwise noted, covering job postings in the City of Philadelphia and the Philadelphia Metro Statistical Area (MSA), which is comprised of roughly a circle surrounding Trenton, Philadelphia, King of Prussia, Camden, and Wilmington. This data is then compared to a benchmark week of February 9th – 15th, which was the last week before the economic impact of COVID-19 began to be reflected in job posting data.
Search
![]()