-
Explore the Neighborhood
Discover everything to do in University City.
-
 Neighborhood GuideOur curated suggestions for seasonal happenings, major landmarks, local guides, and new offerings.
 -
 Community CalendarEvents including restaurants promotions, concerts, live theater, community meetings, art galleries & public spaces
 -
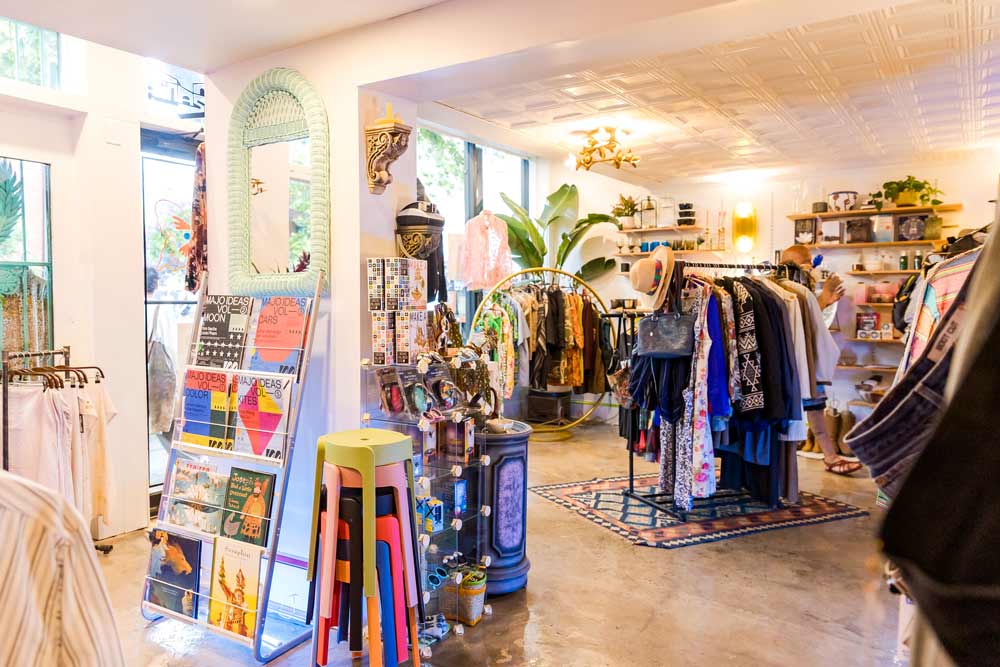 Local Businesses GuideAn interactive map below serves as a guide to find where to dine, shop, relax, and much more!
 -
 Summer in University CityStay up-to-date on all the great events happening throughout the neighborhood all summer!
-
-
Our Events
Enjoy University City District's signature events.
-
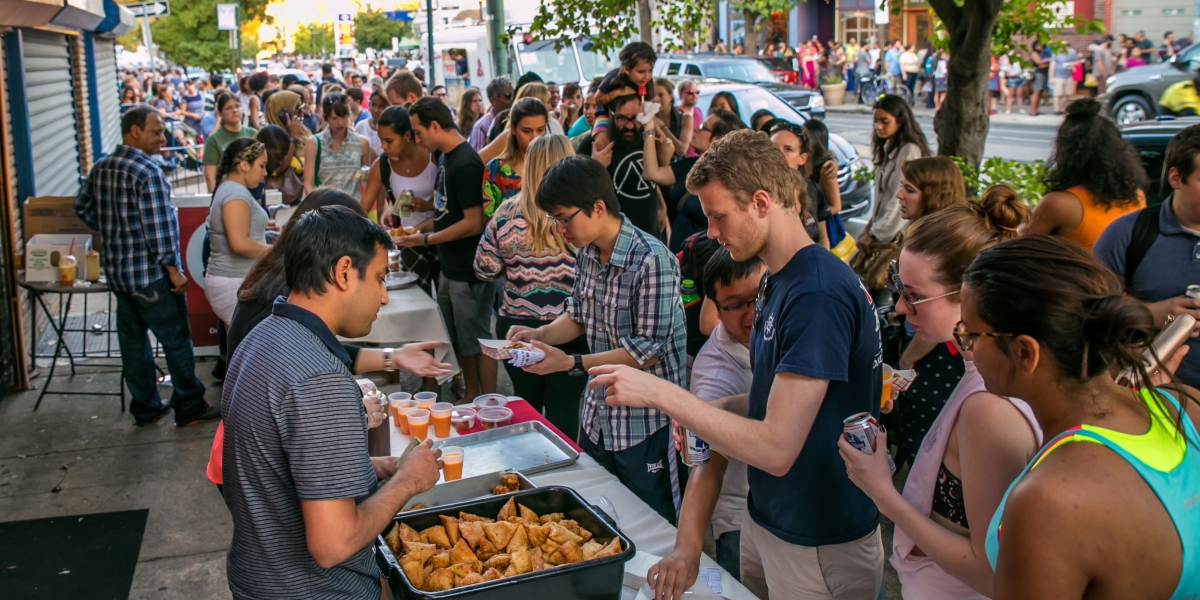 Baltimore Avenue Dollar Stroll$1, $3, and $5 deals from local businesses & vendors
 -
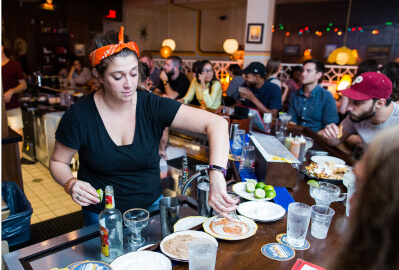 University City Dining DaysUniversity City’s version of “restaurant week”
 -
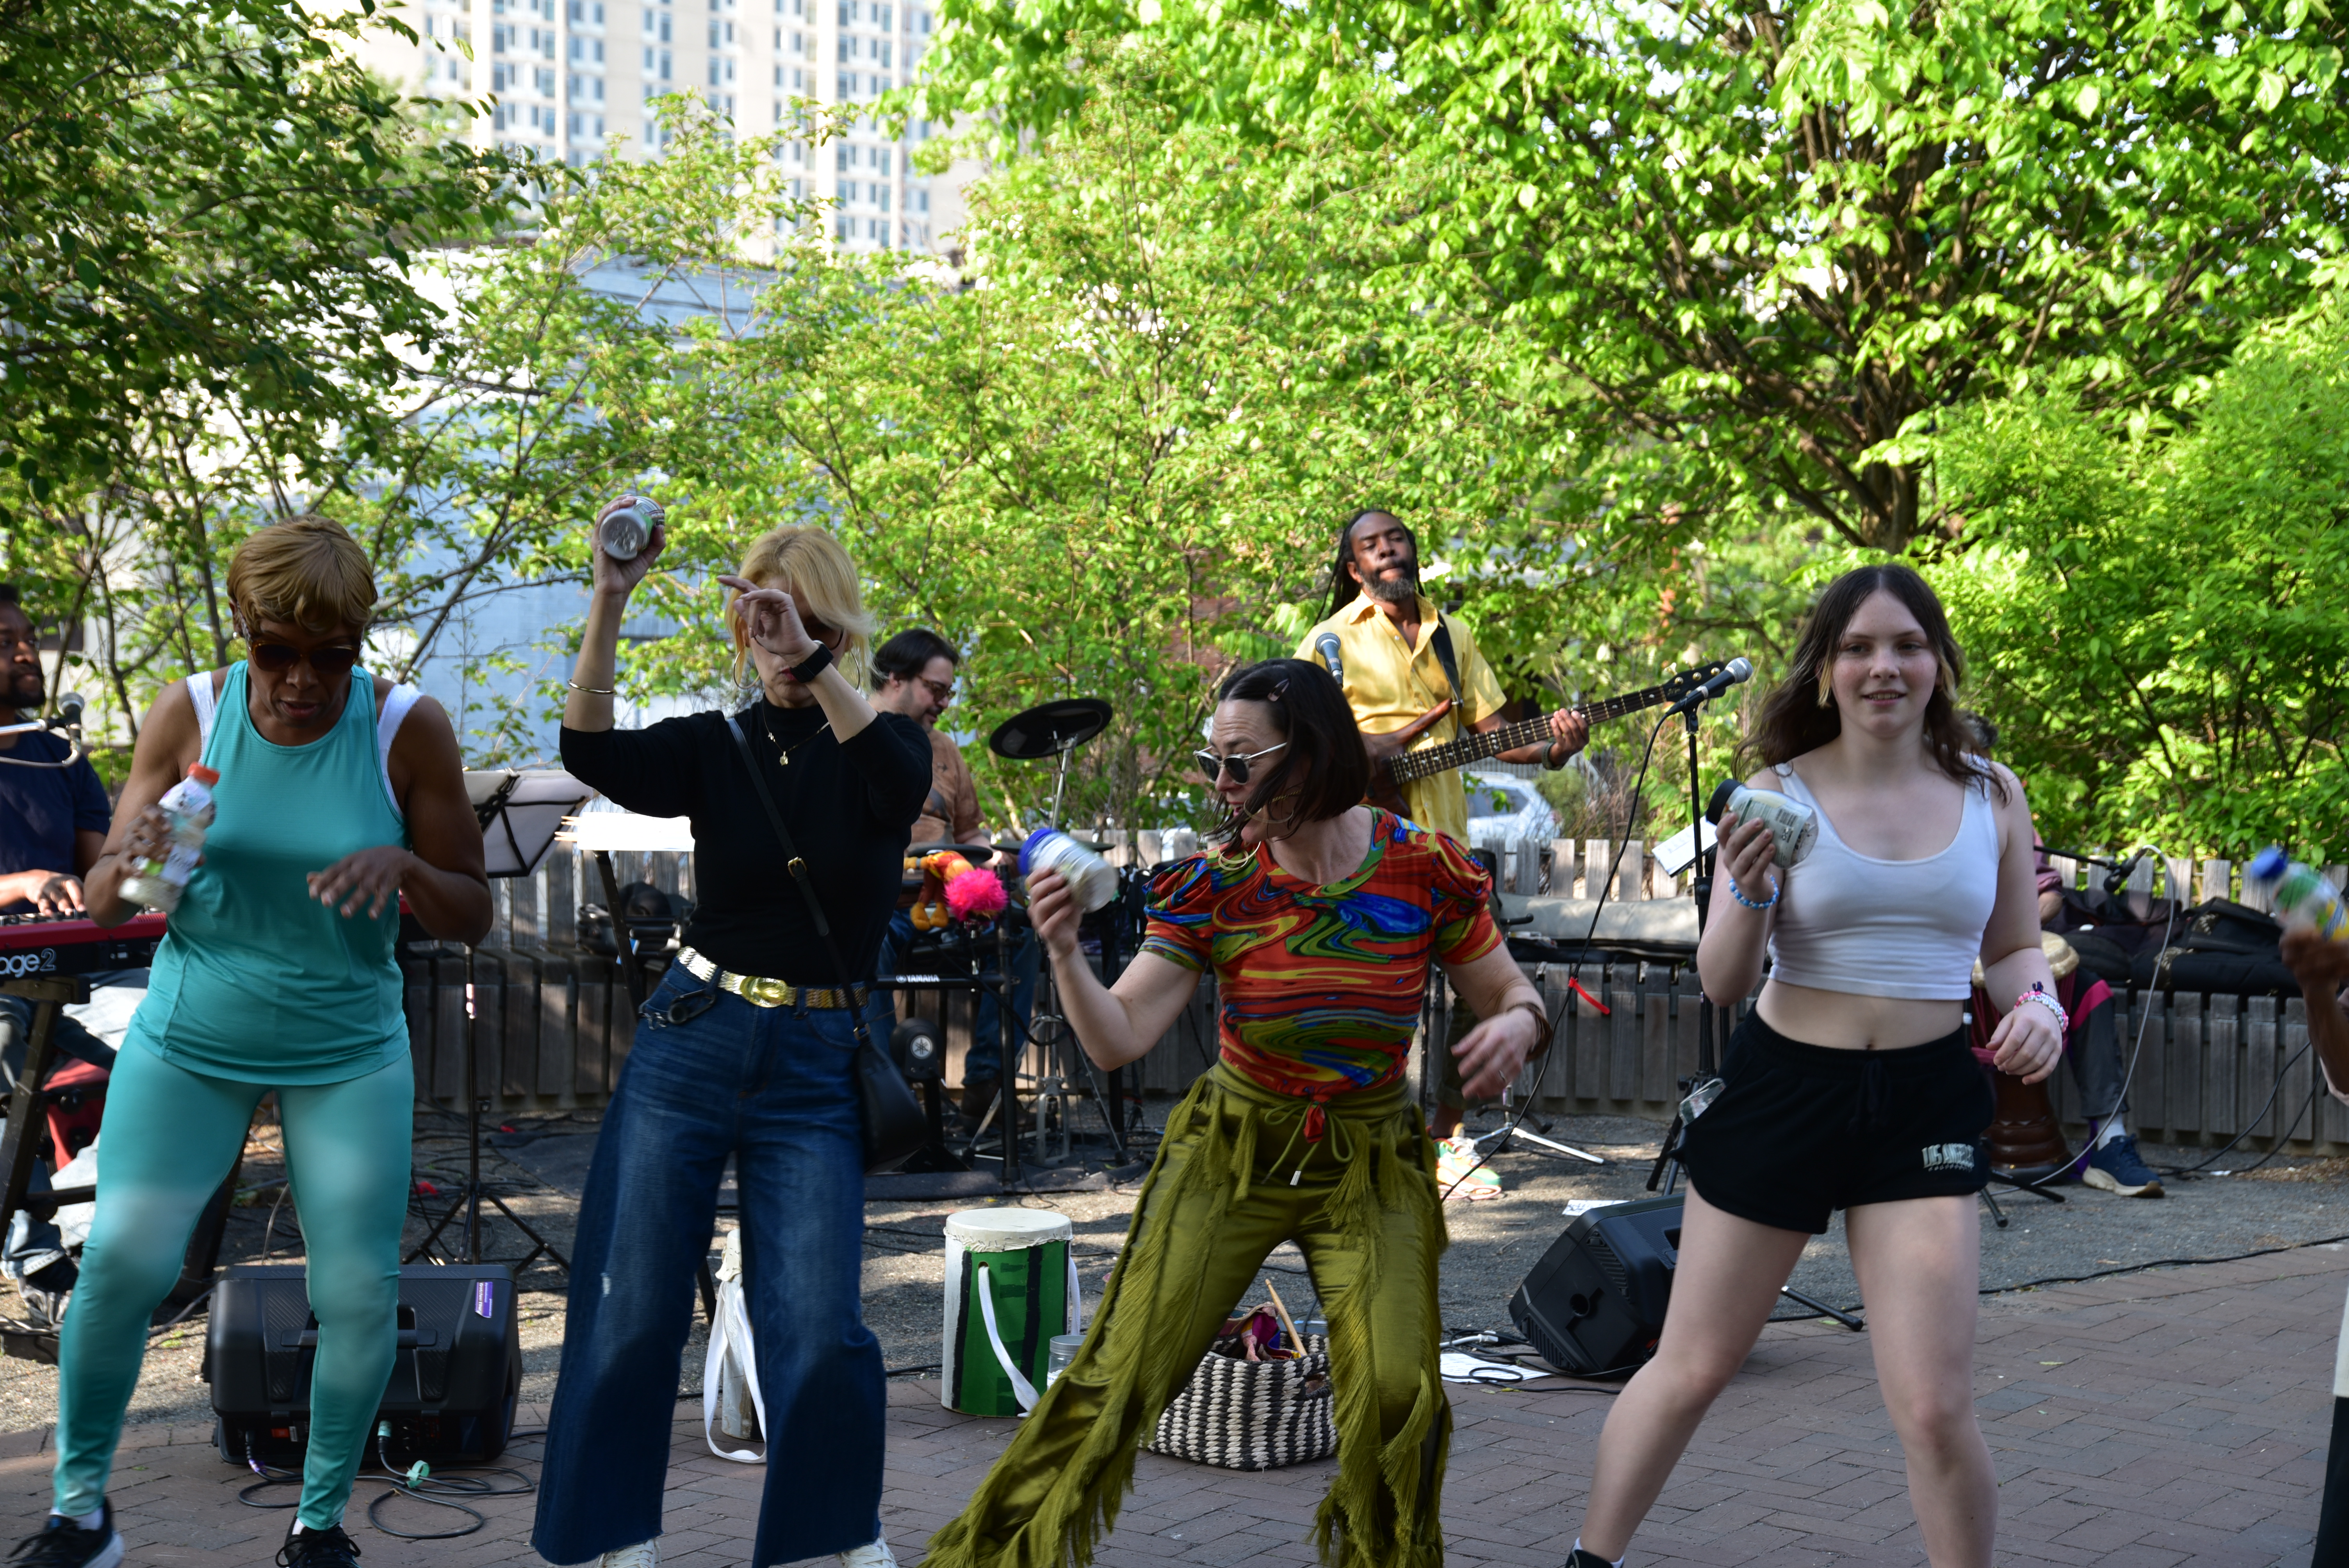
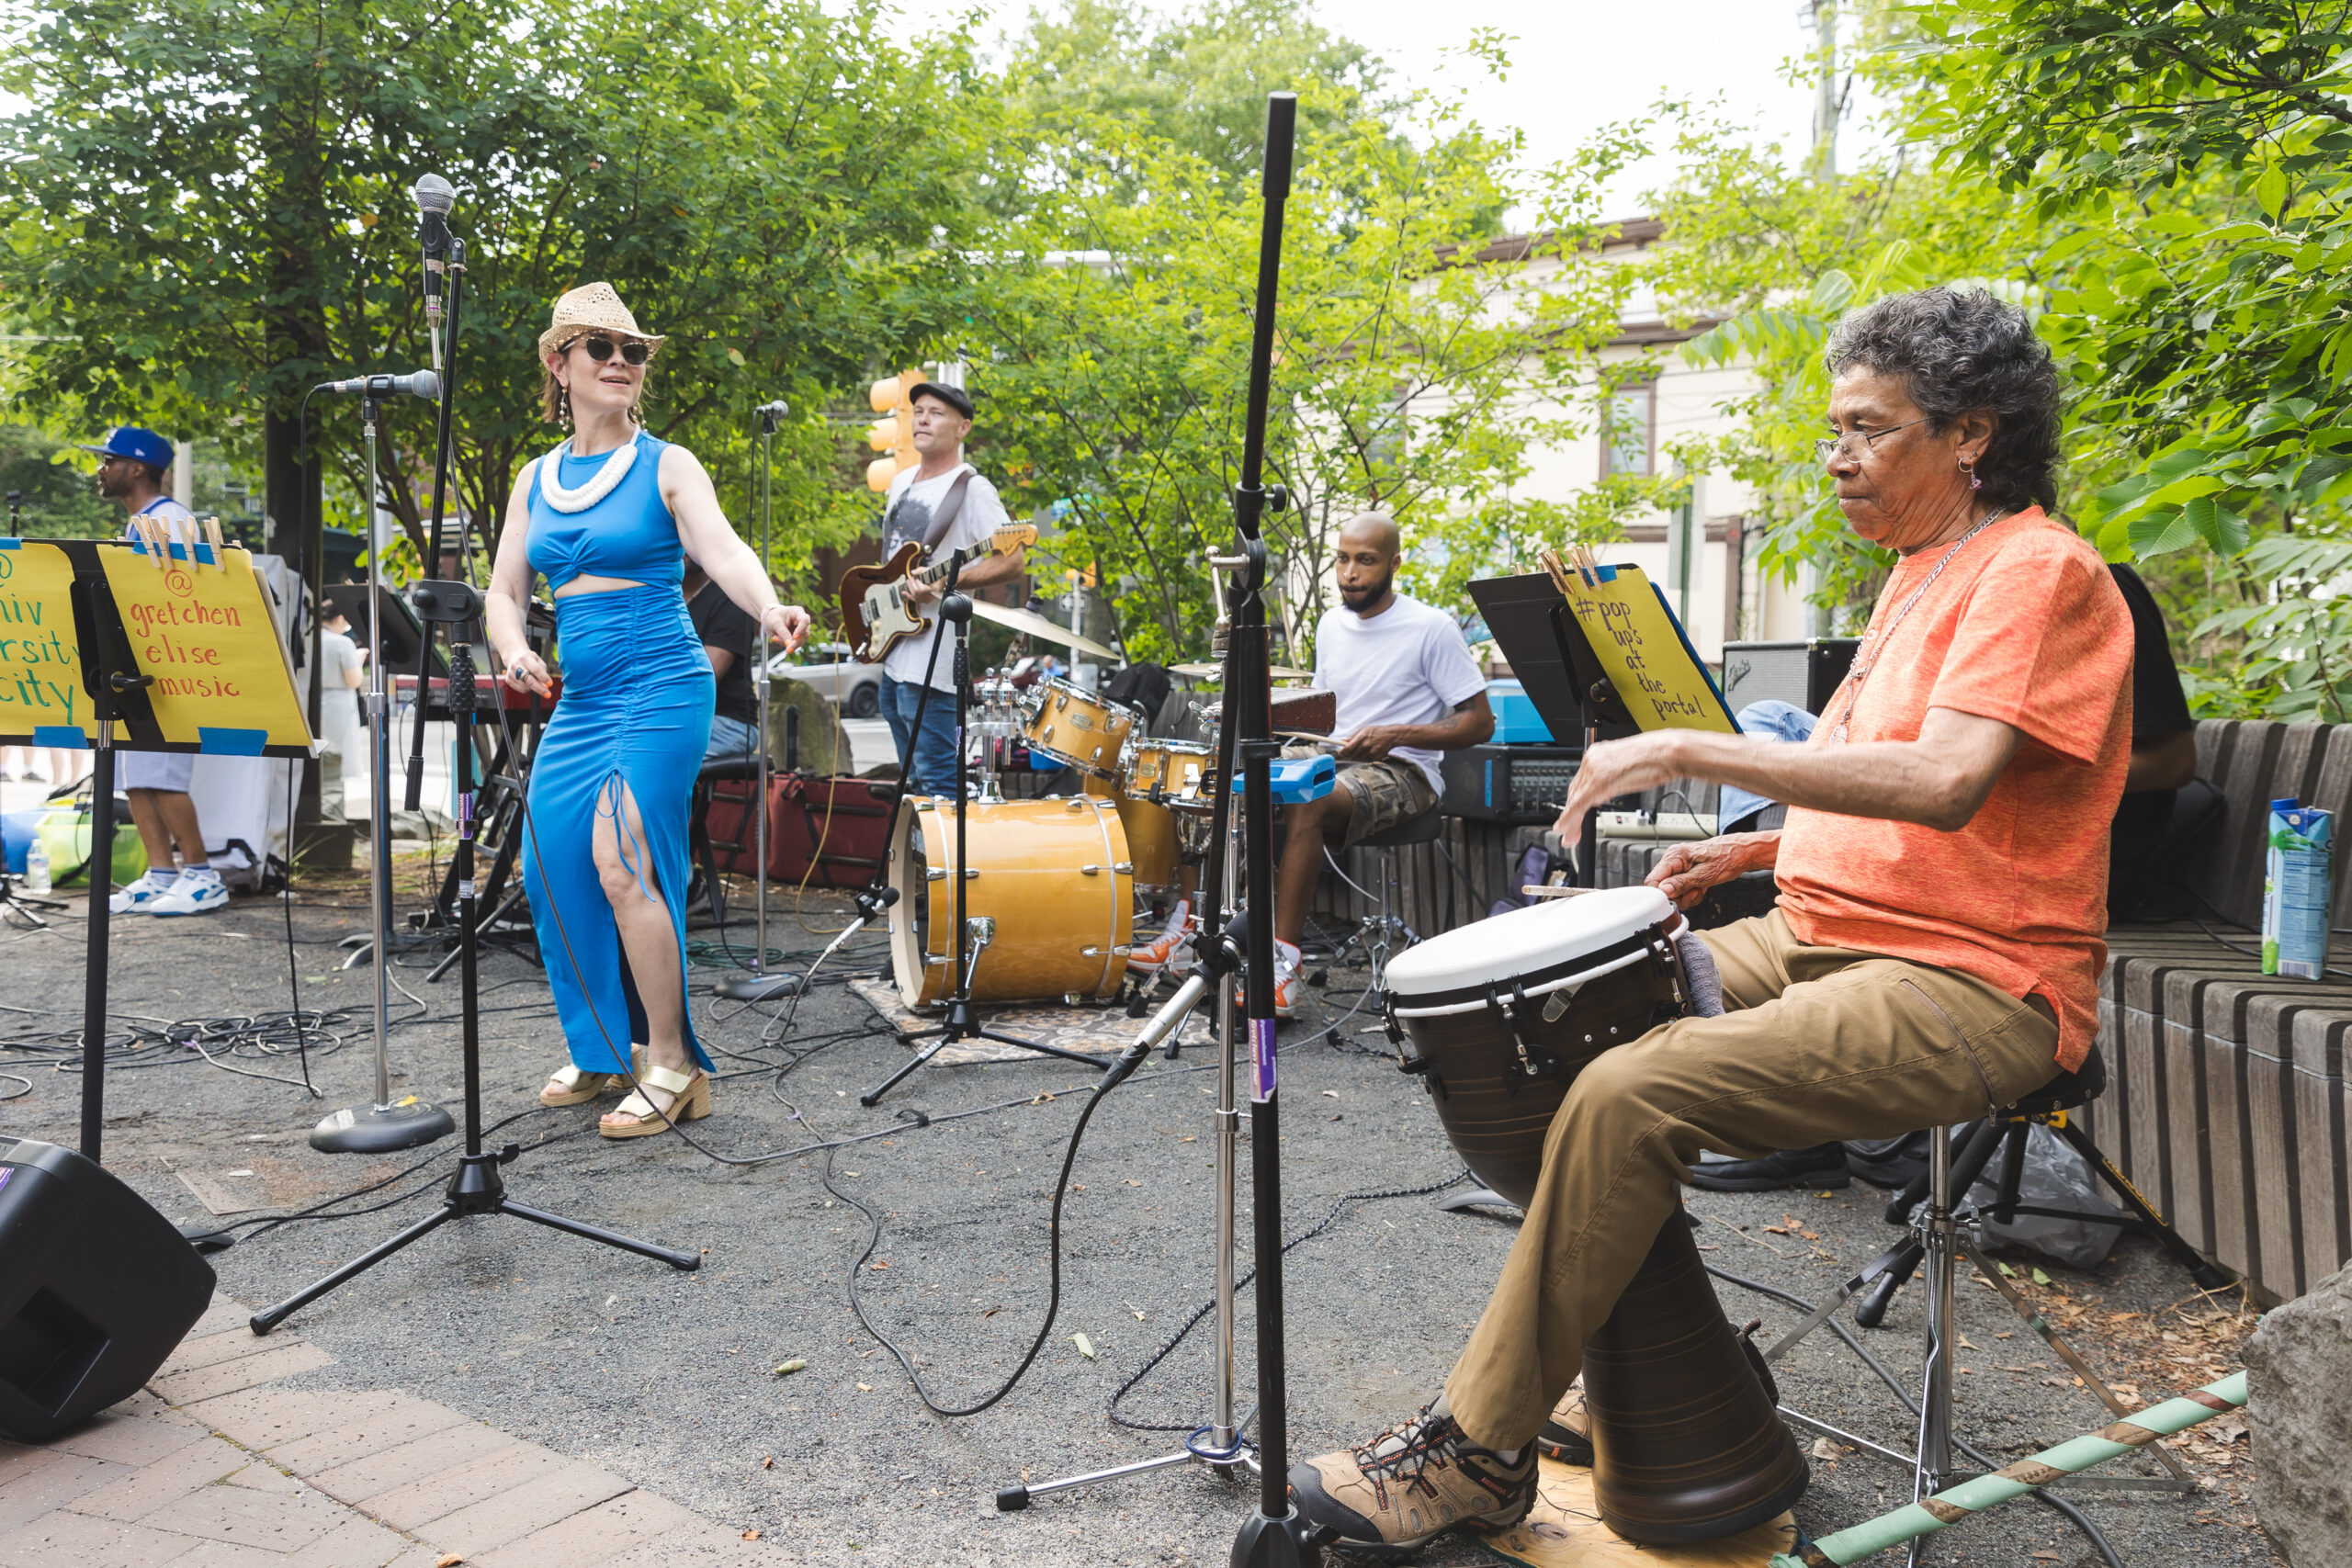
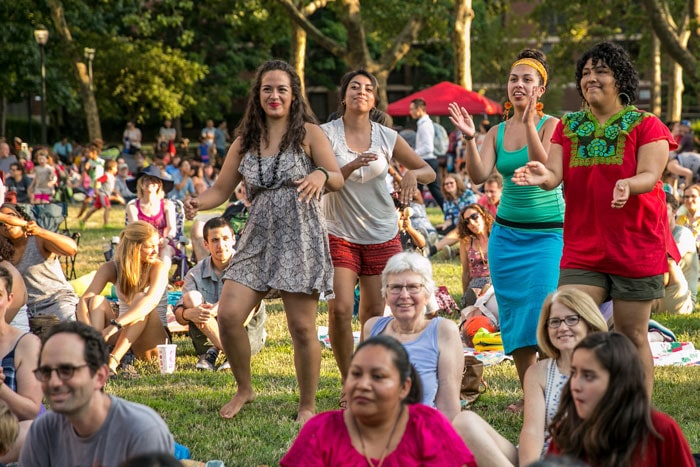
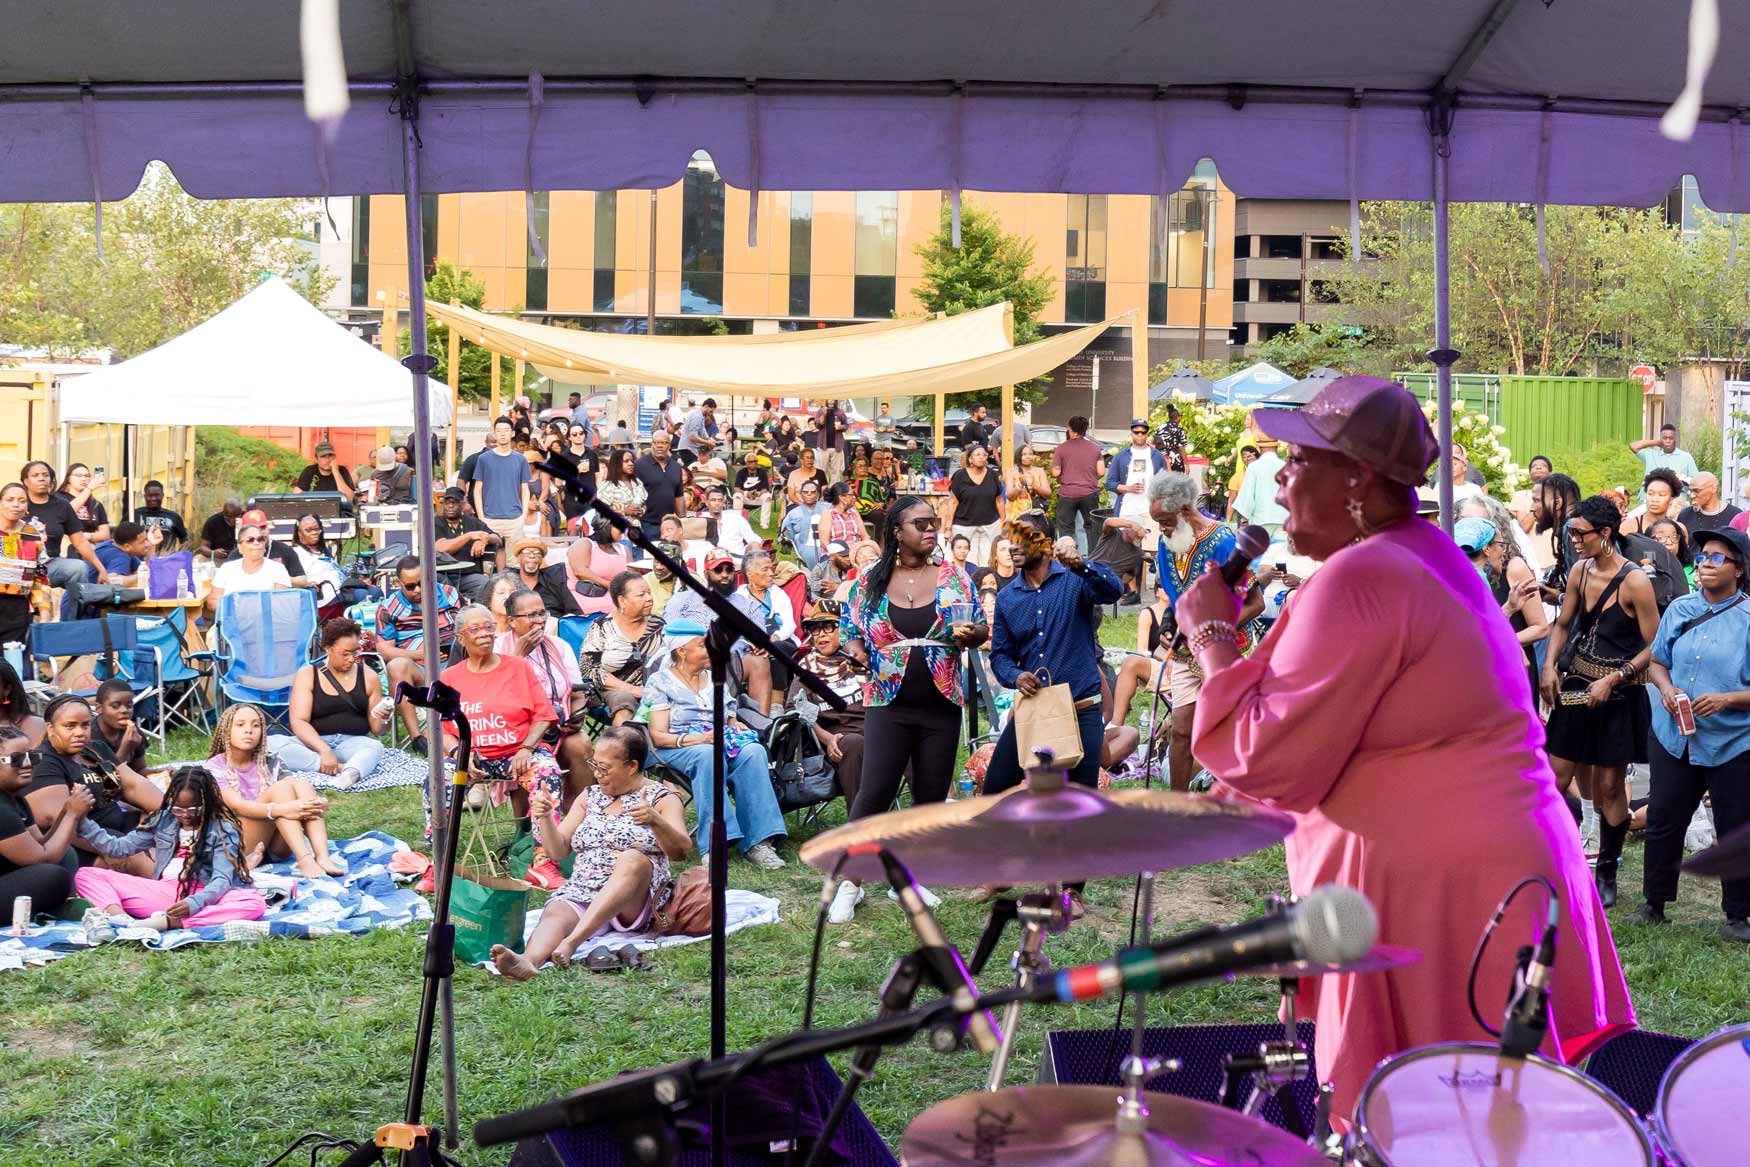 University City Summer SeriesFamily-friendly free outdoor summer concerts
 -
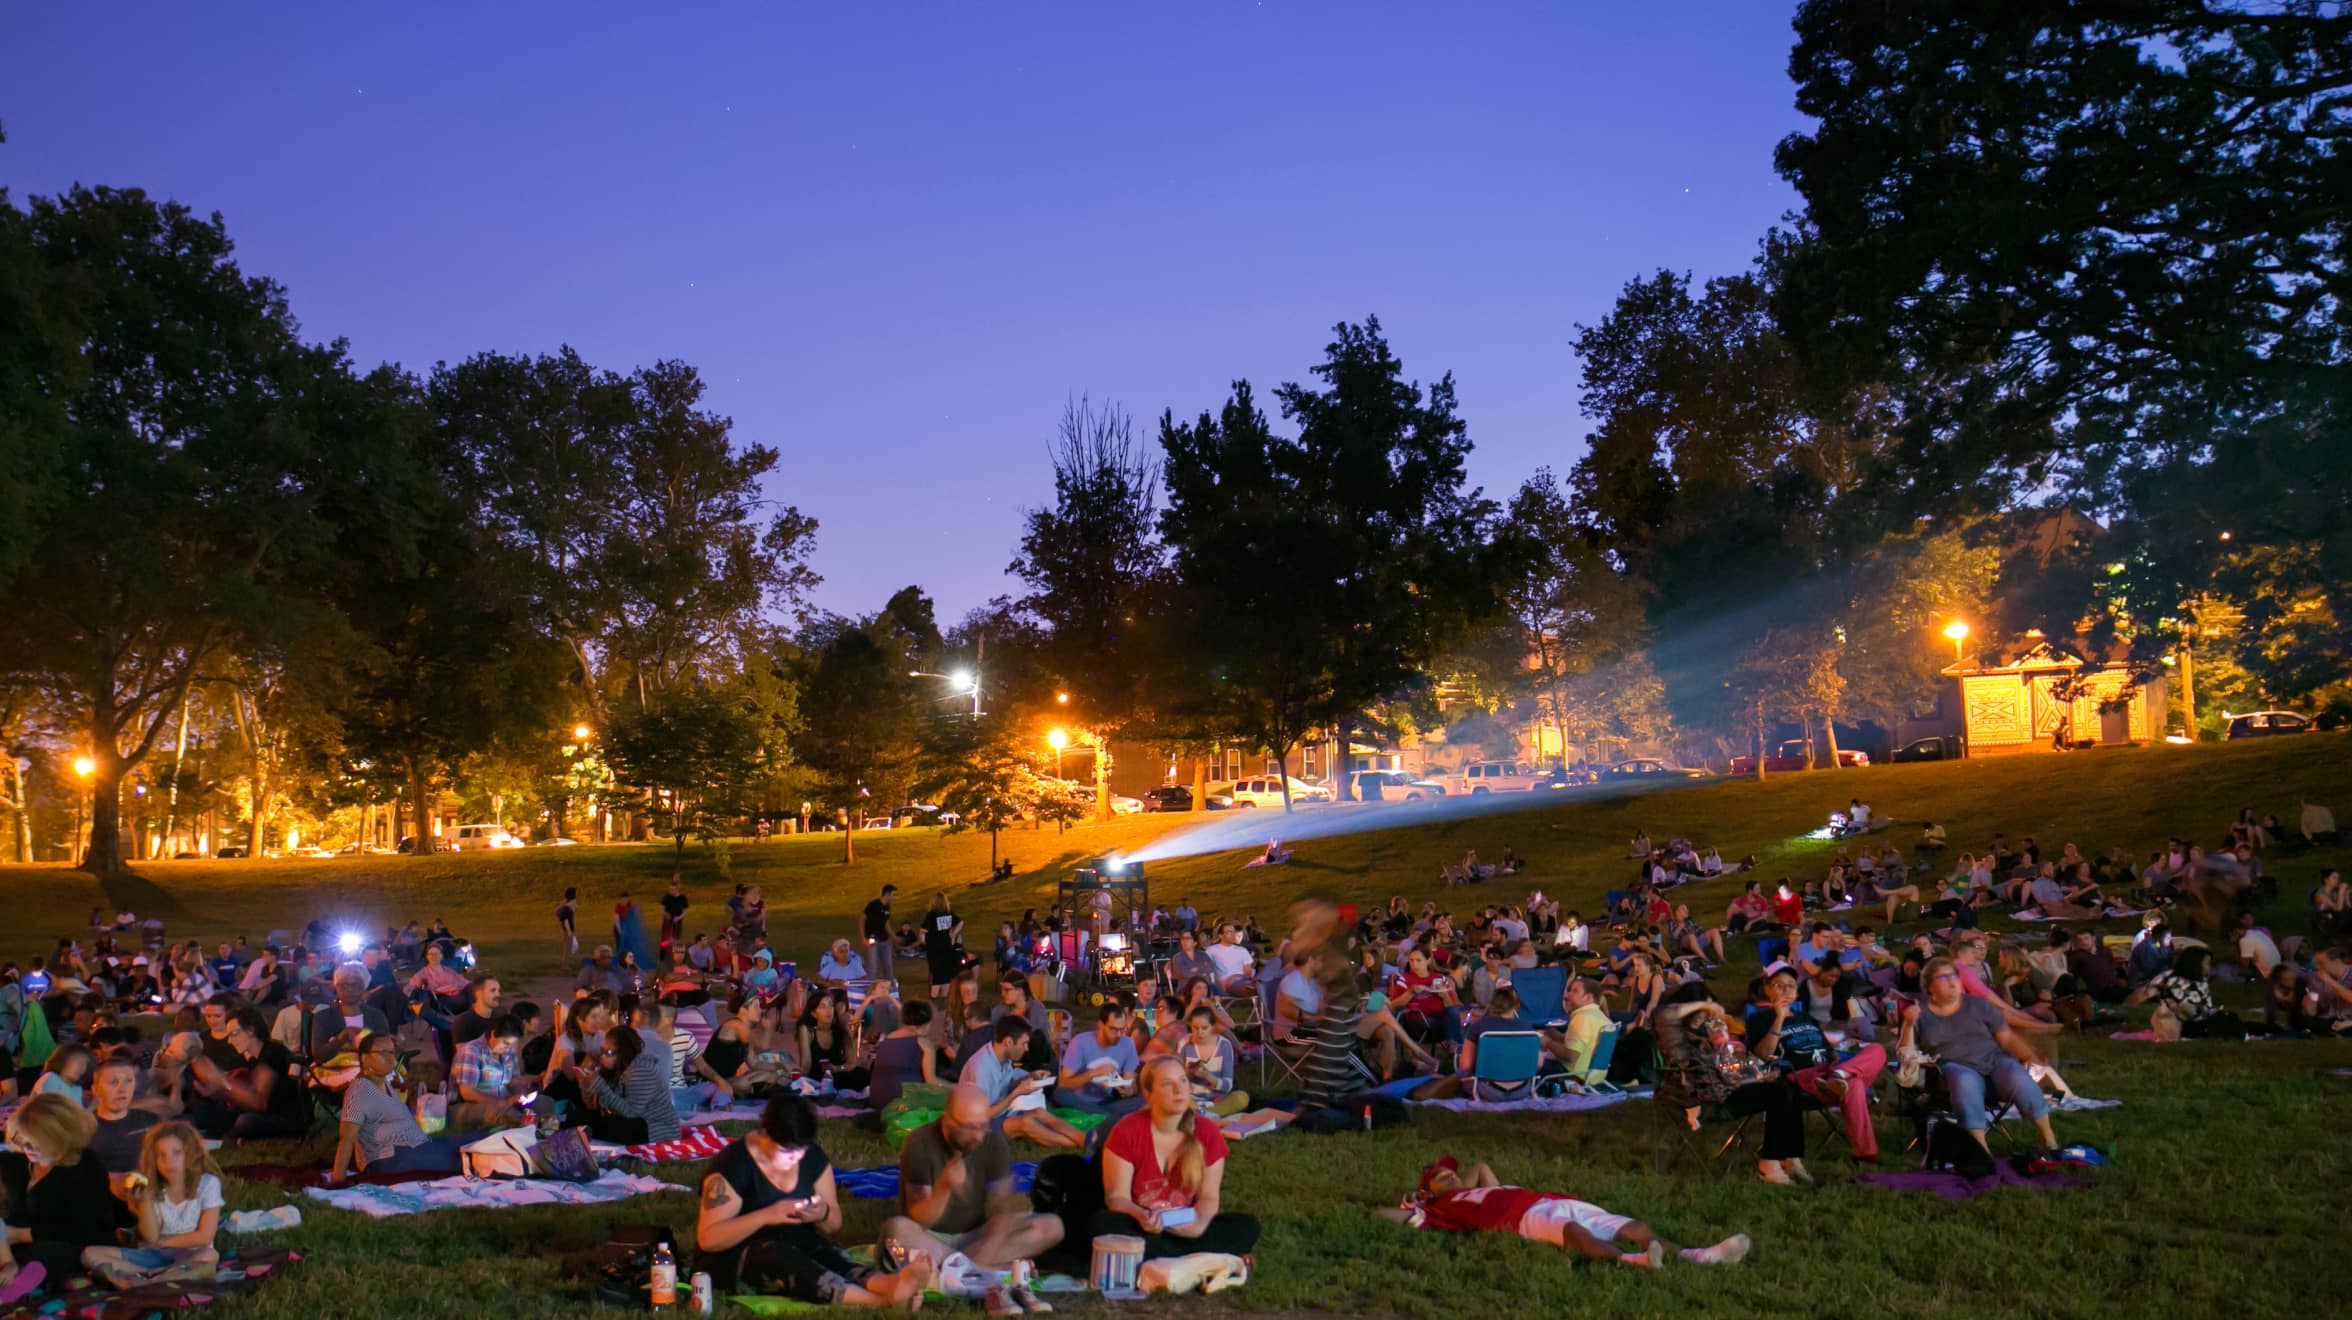
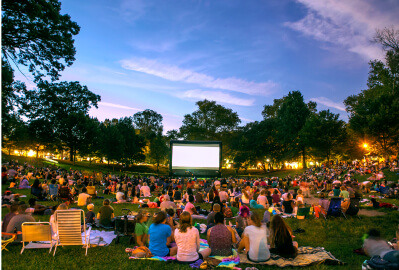 Movies in Clark ParkFamily-friendly free outdoor screenings every August
 -
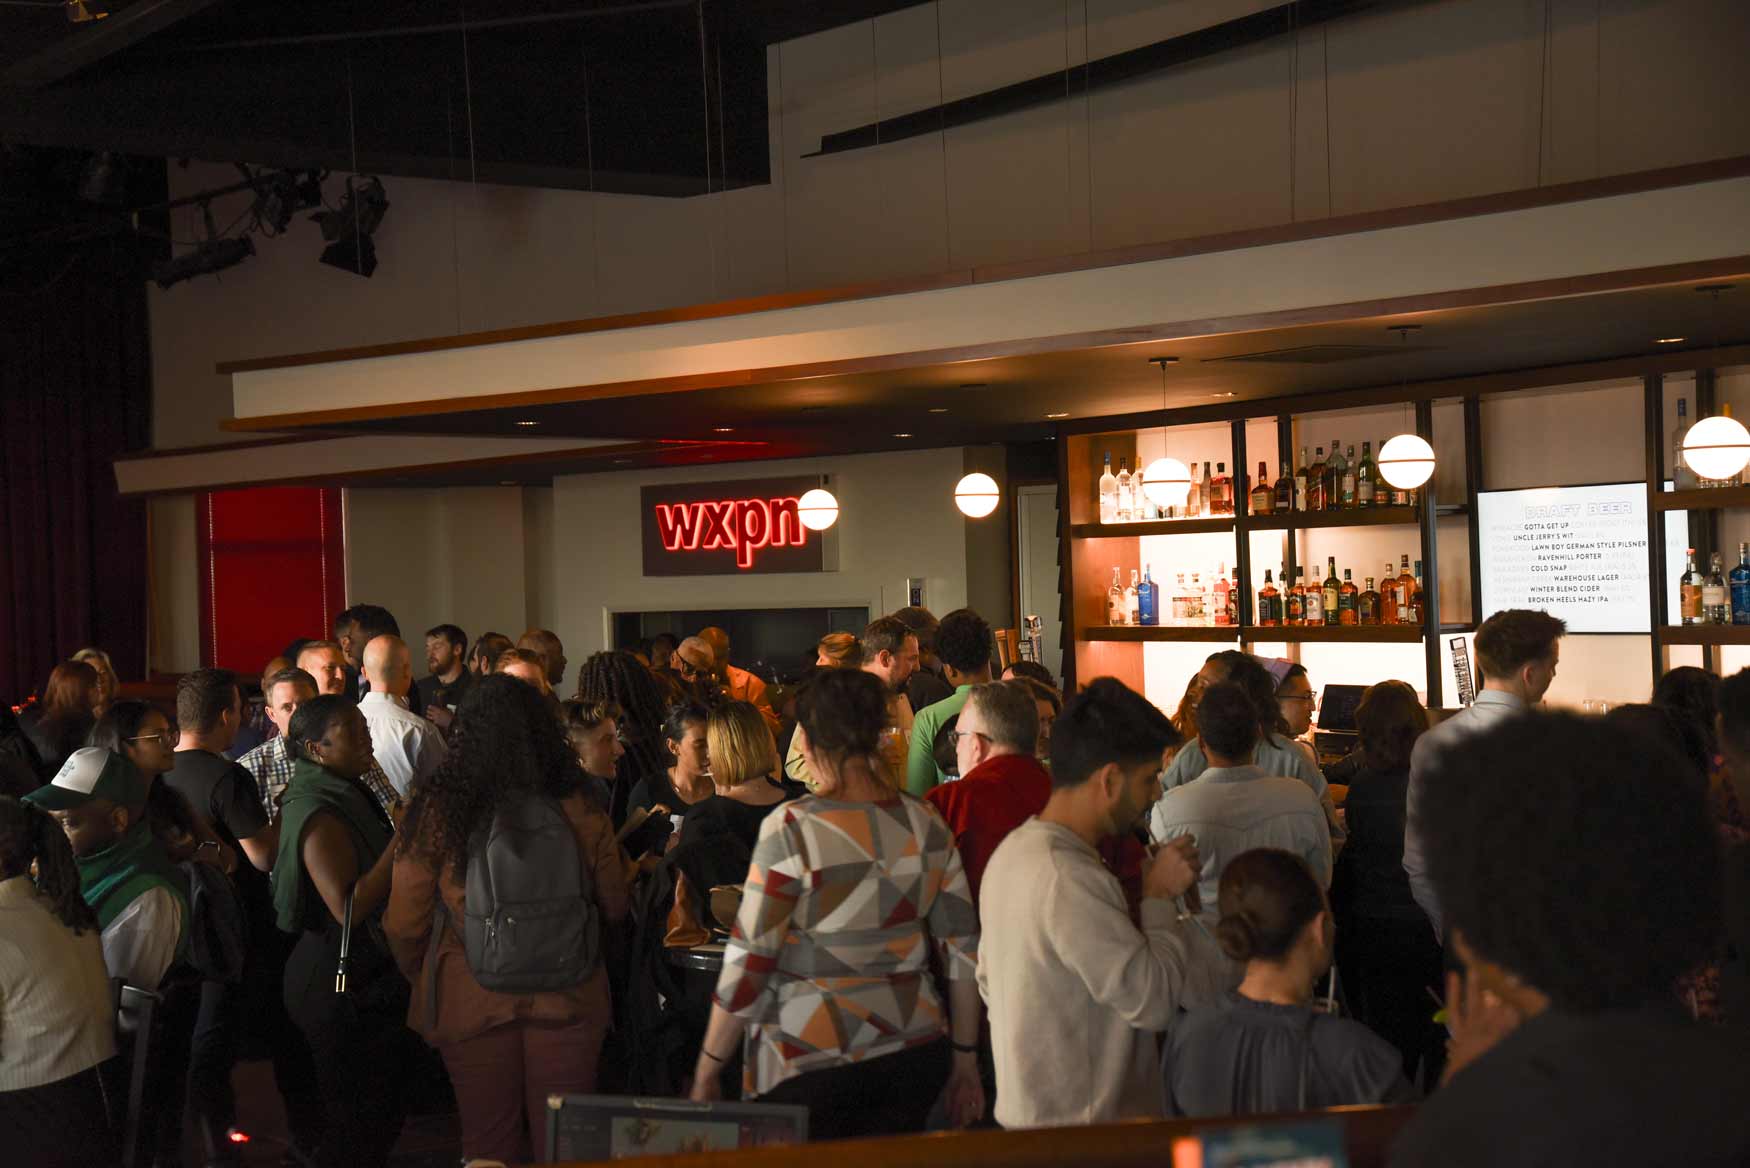 University City MixNetworking happy hour series
 -
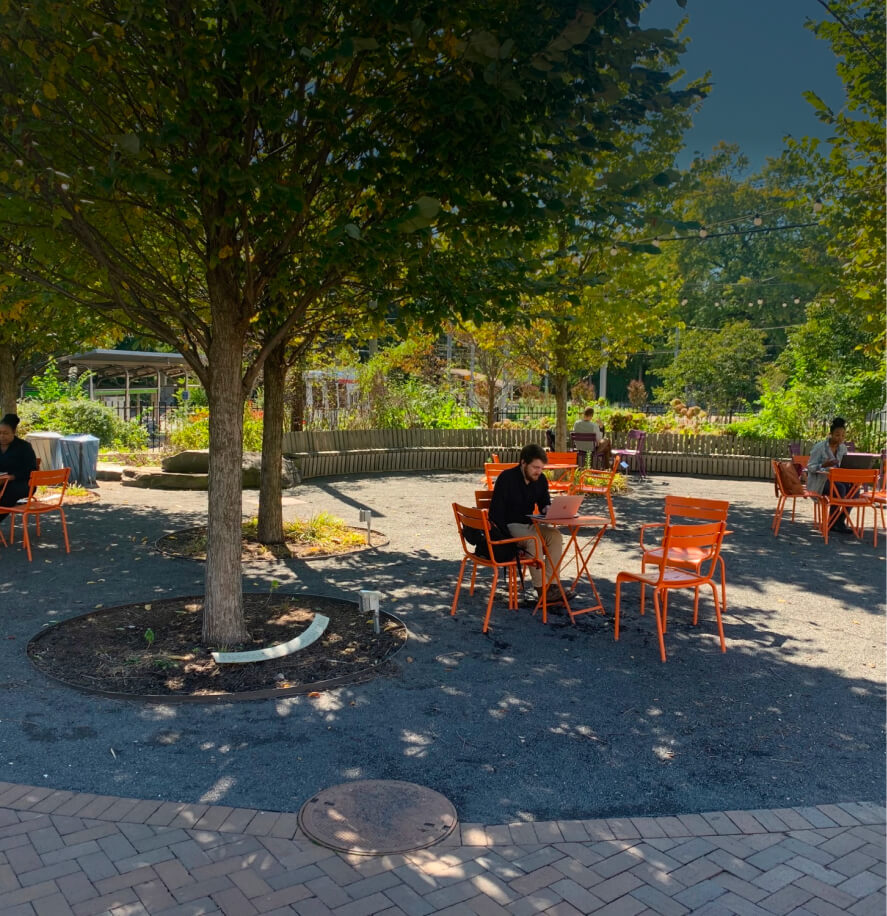
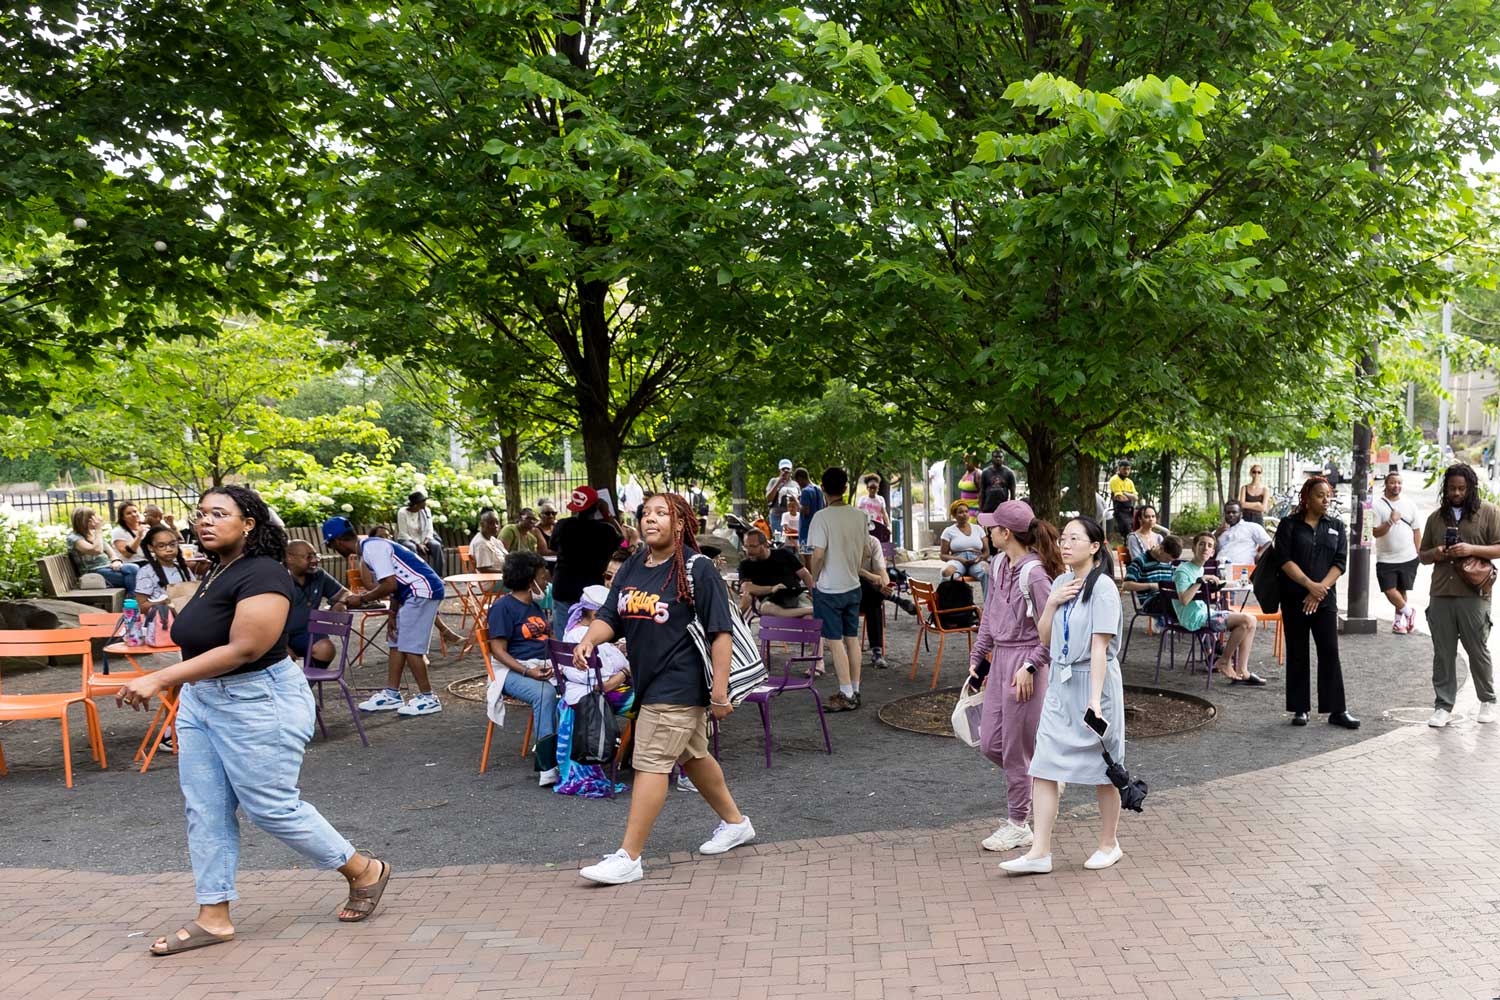 Trolley Portal Gardens EventsFamily-friendly free events at 40th & Baltimore
- About UCD
Learn more about UCD and our thriving neighborhood.-
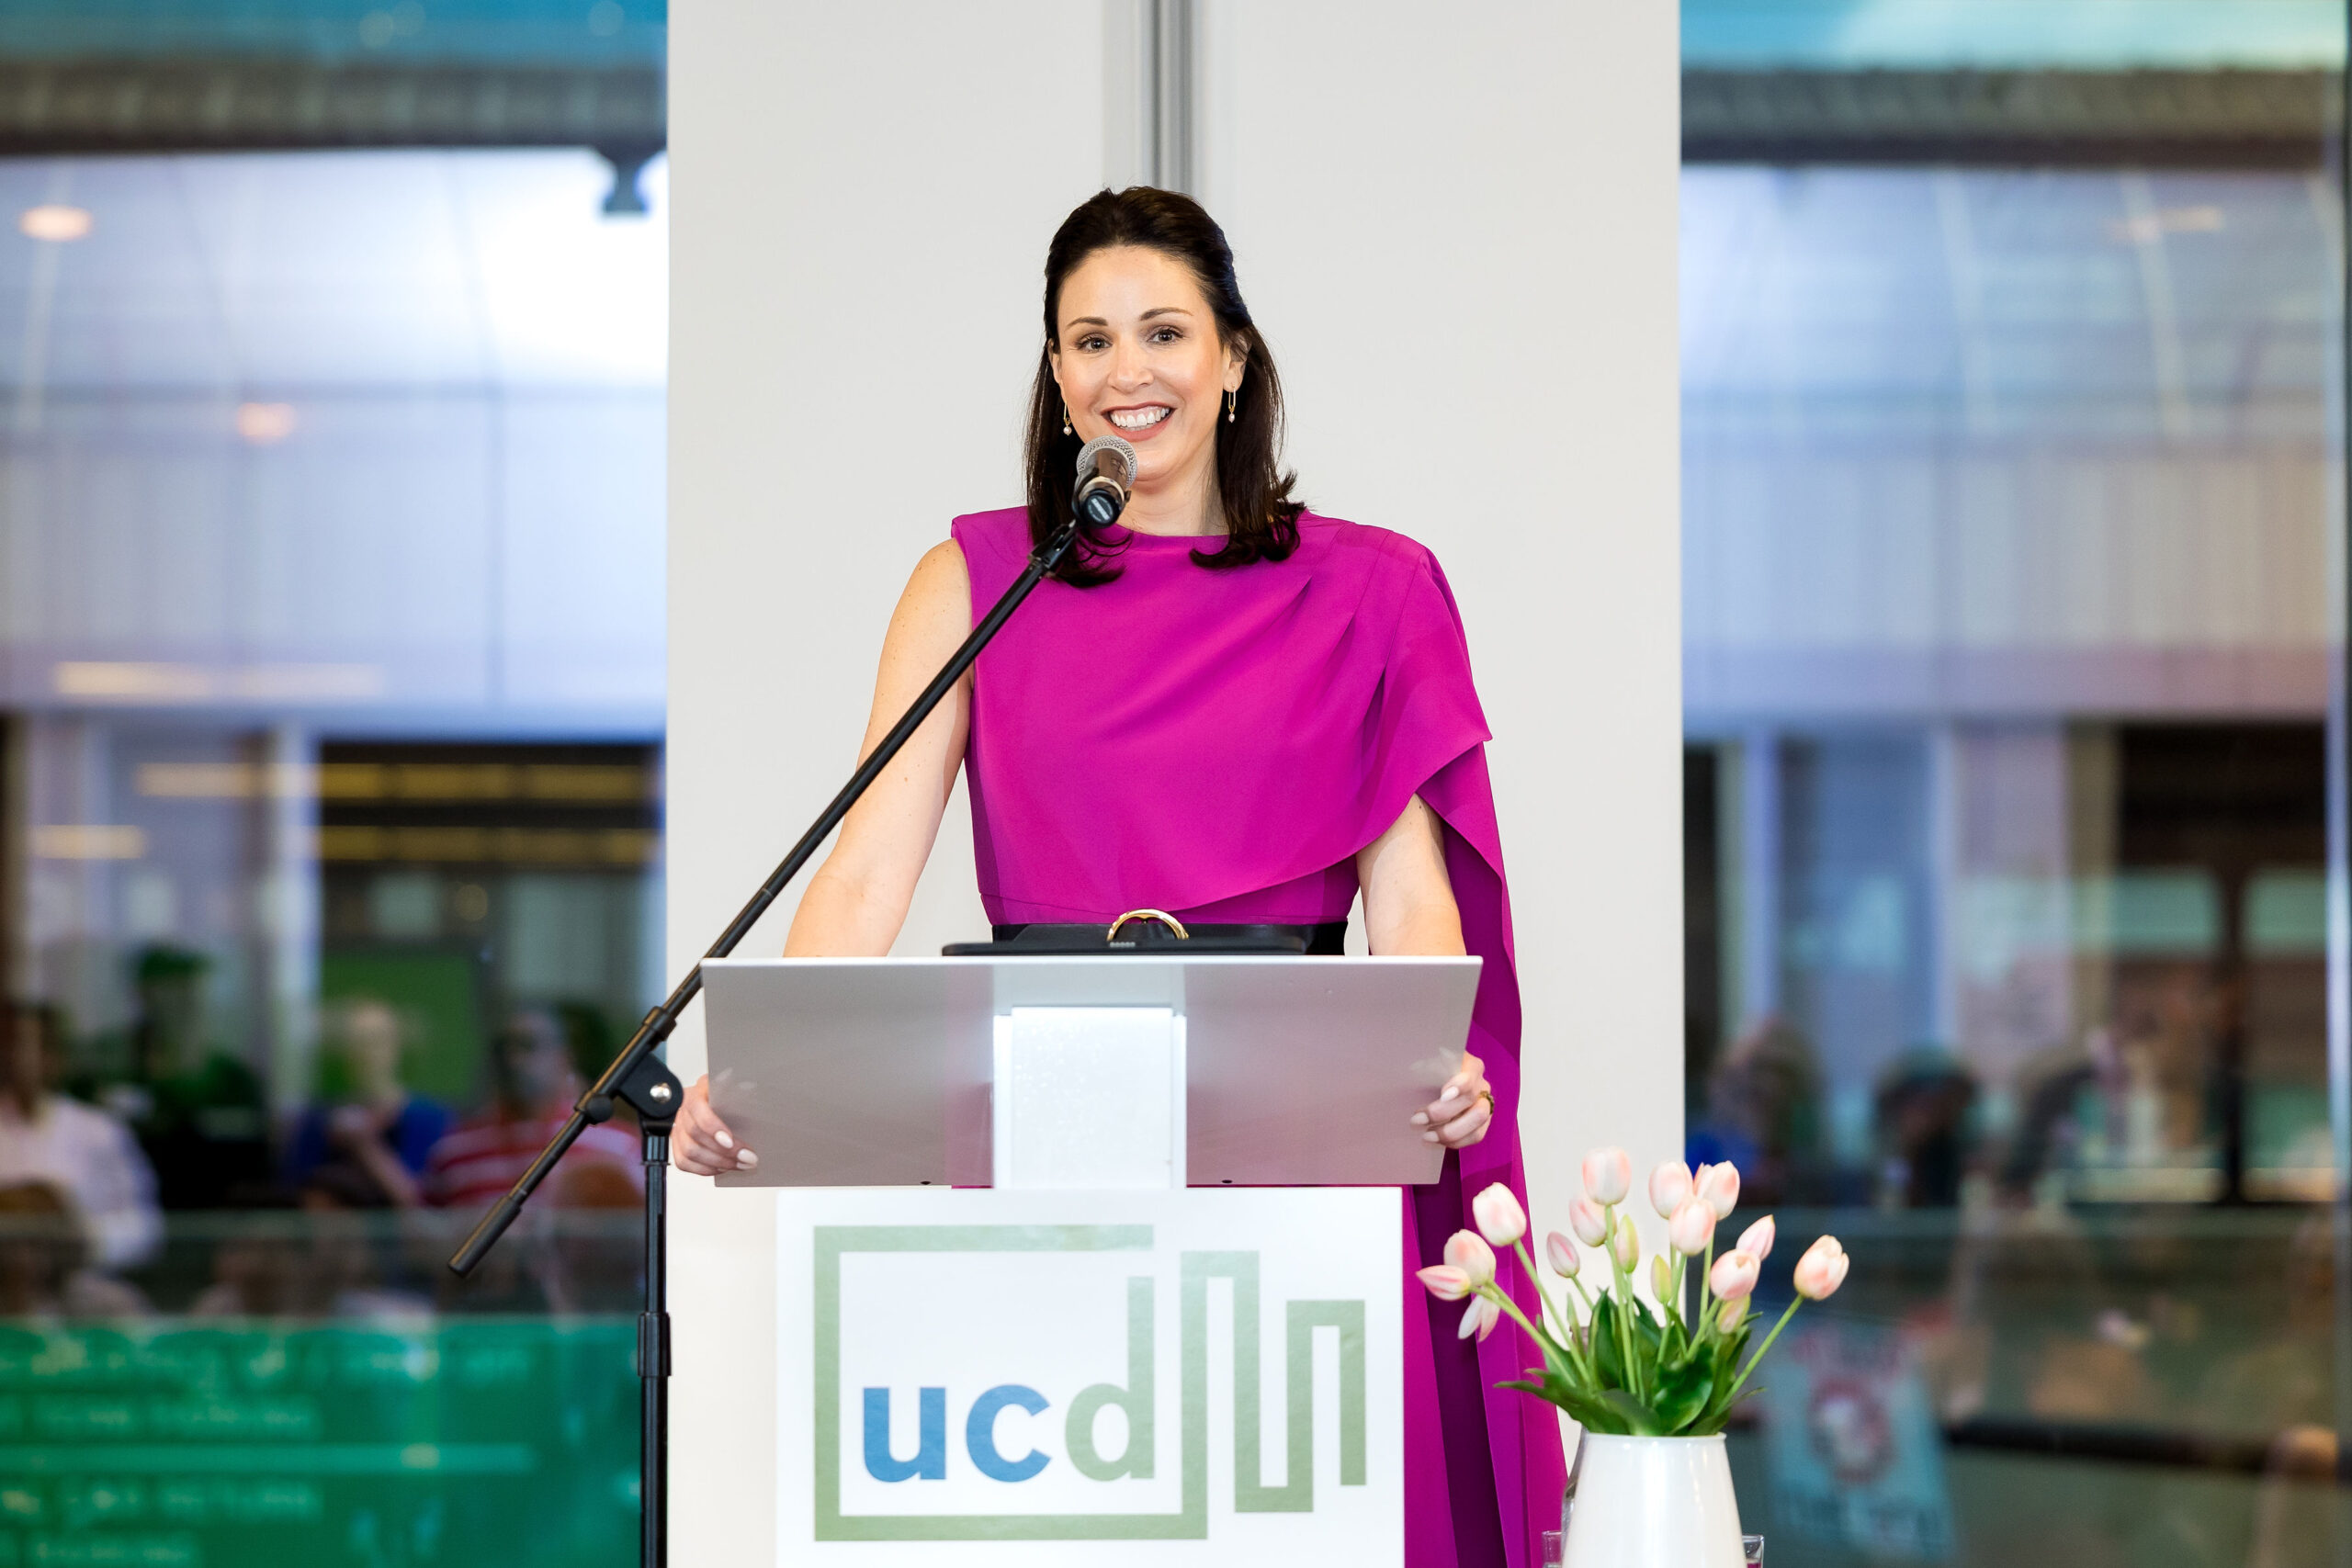
 Latest NewsUpdates on UCD's work and the neighborhood.
 -
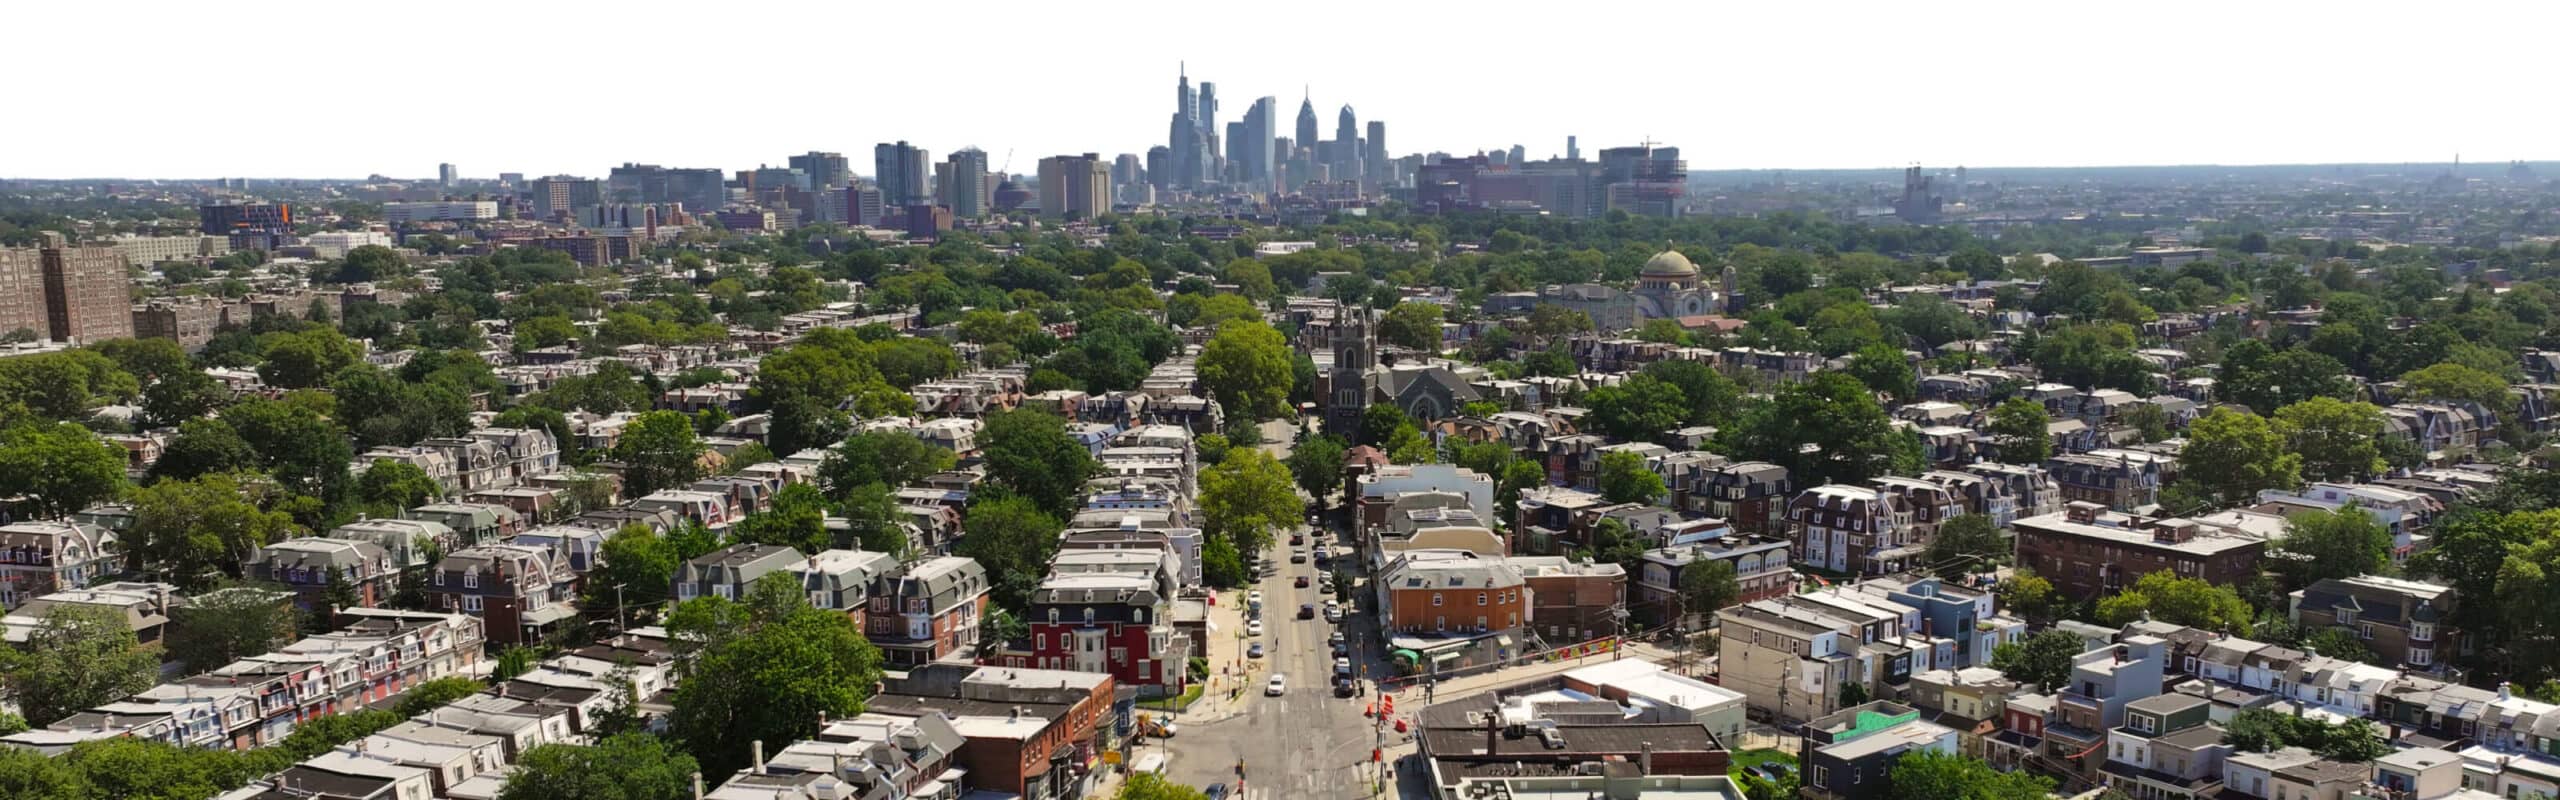
 What is University City District?A partnership of world-renowned anchor institutions, small businesses, and residents that creates opportunities and improves economic vitality and quality of life in the University City section of West Philadelphia.
 -
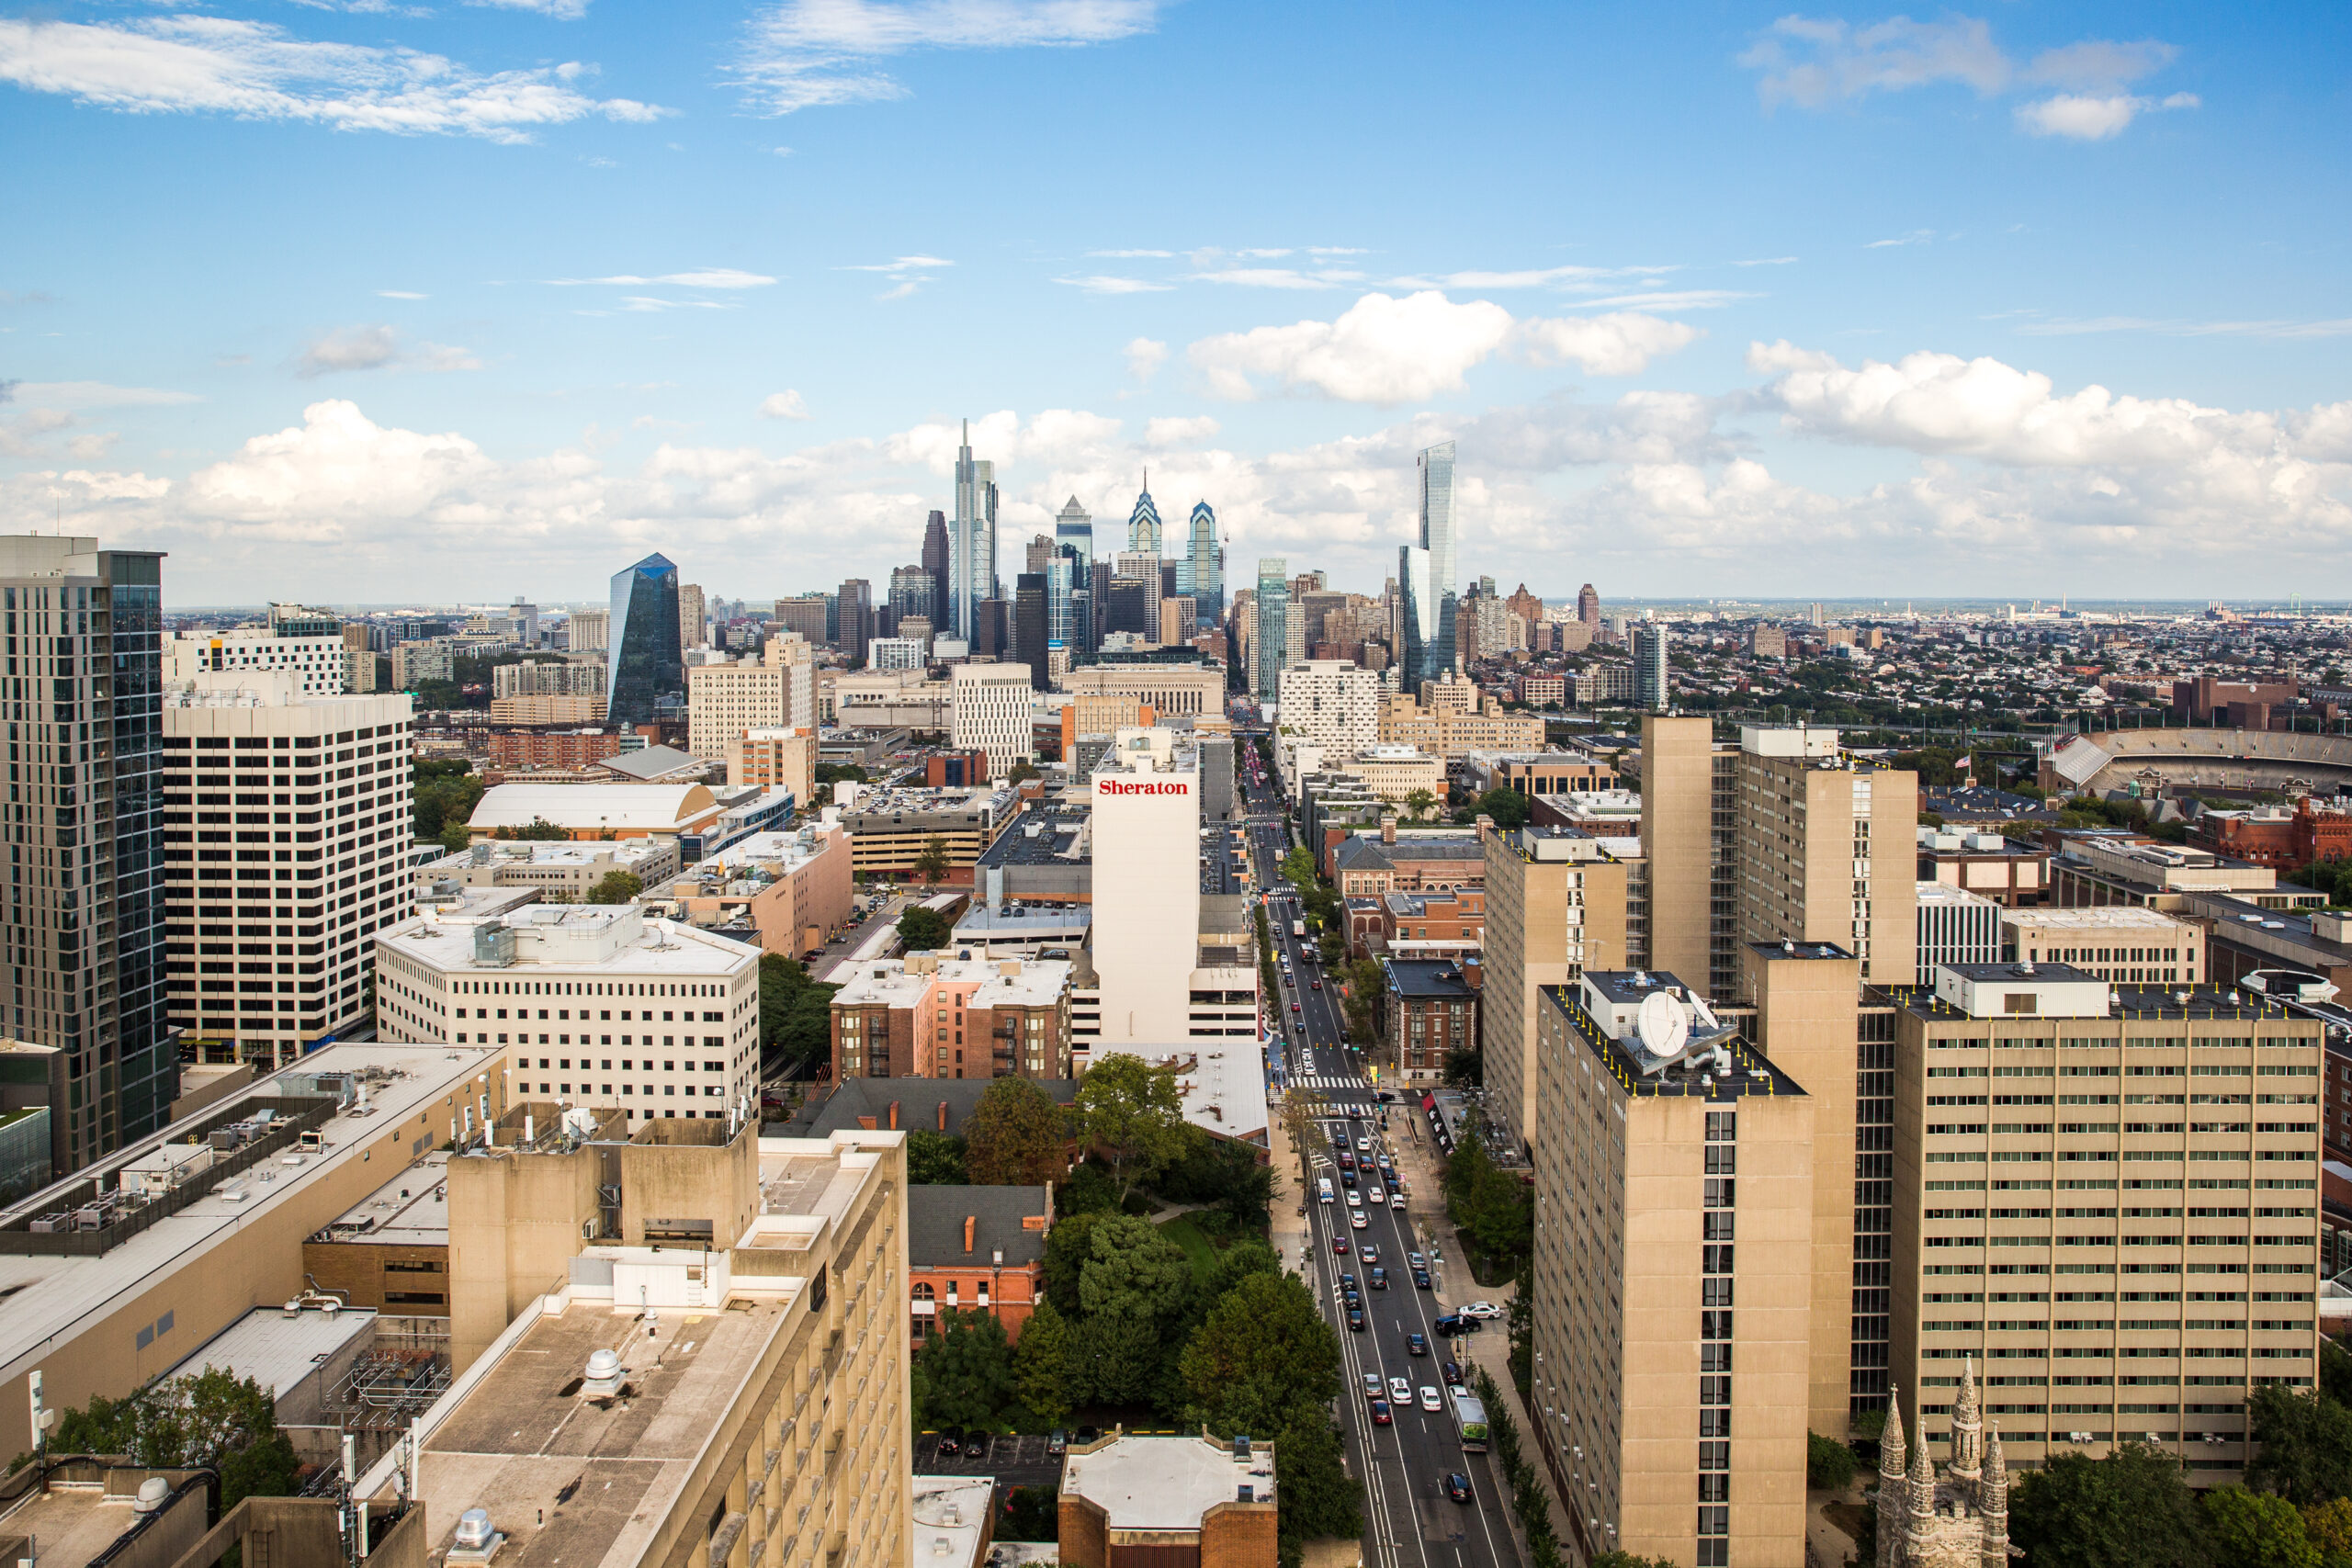
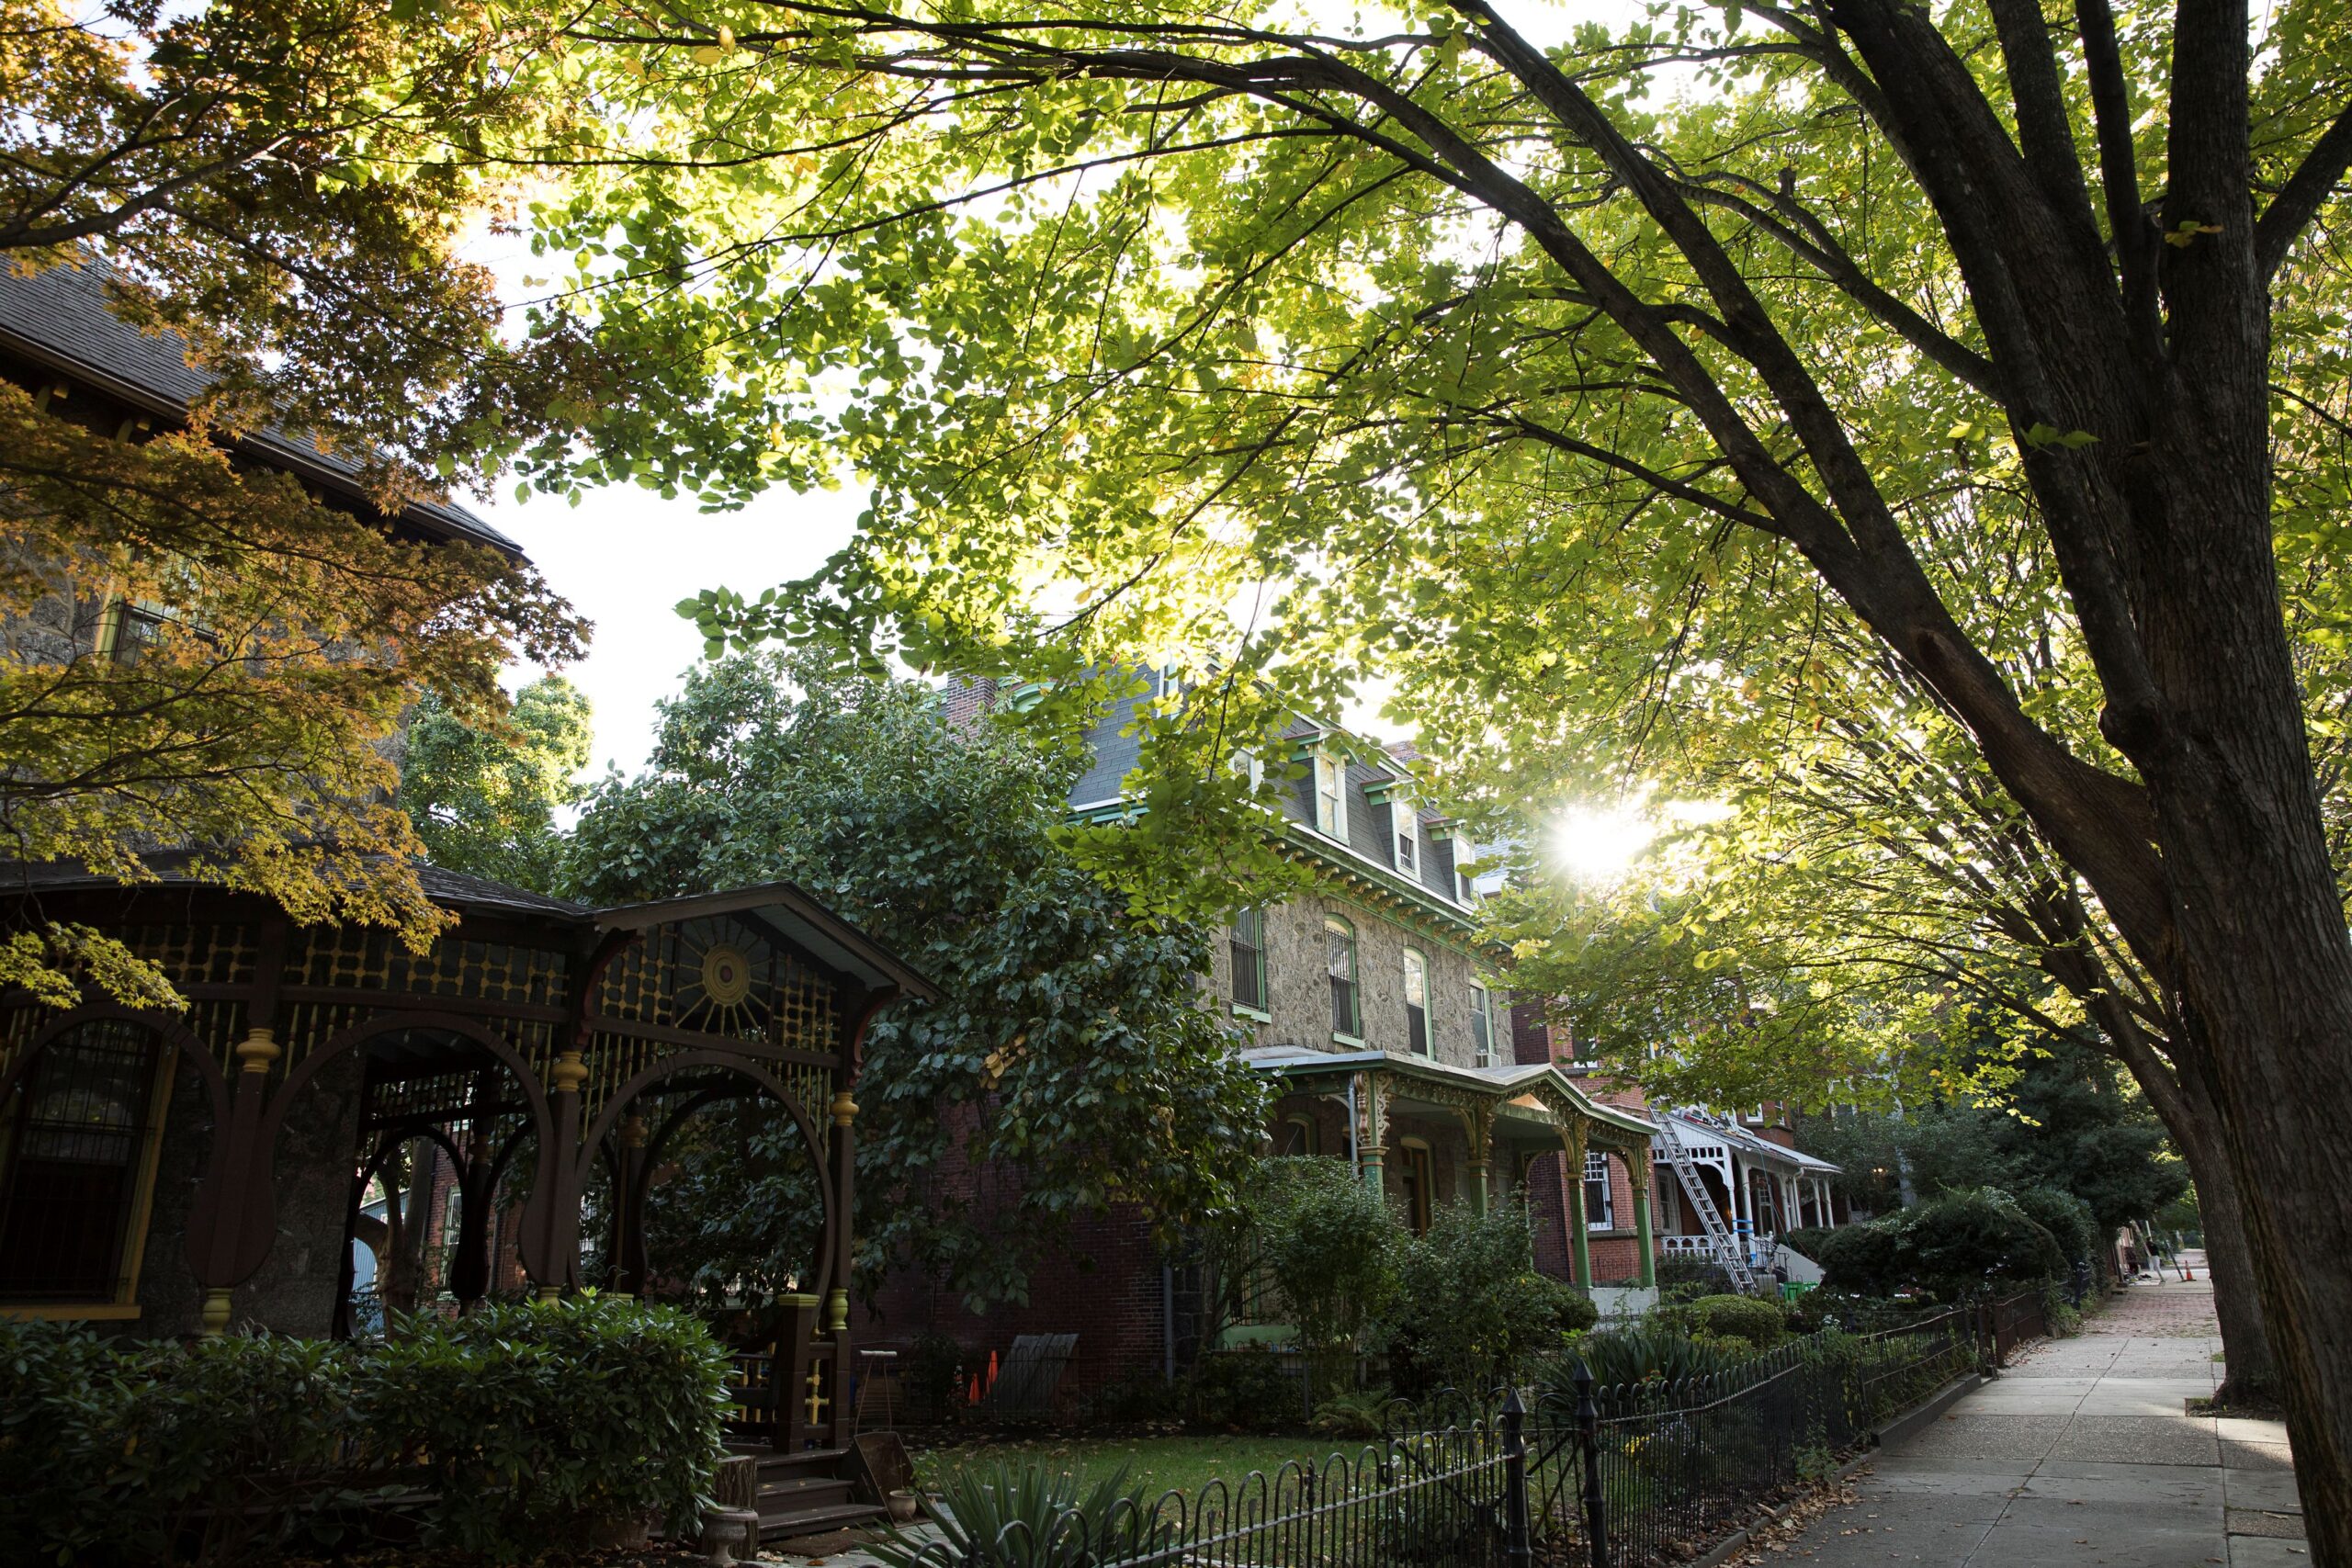
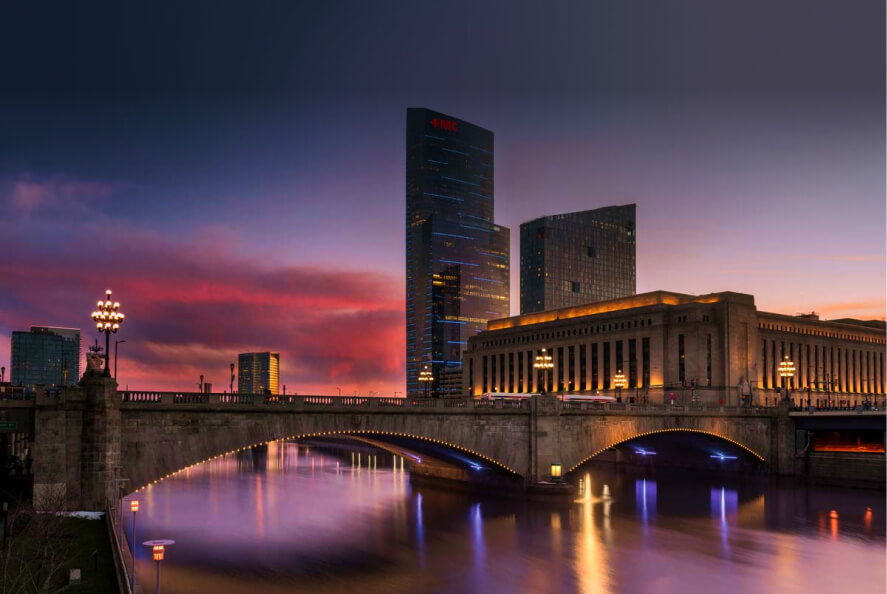
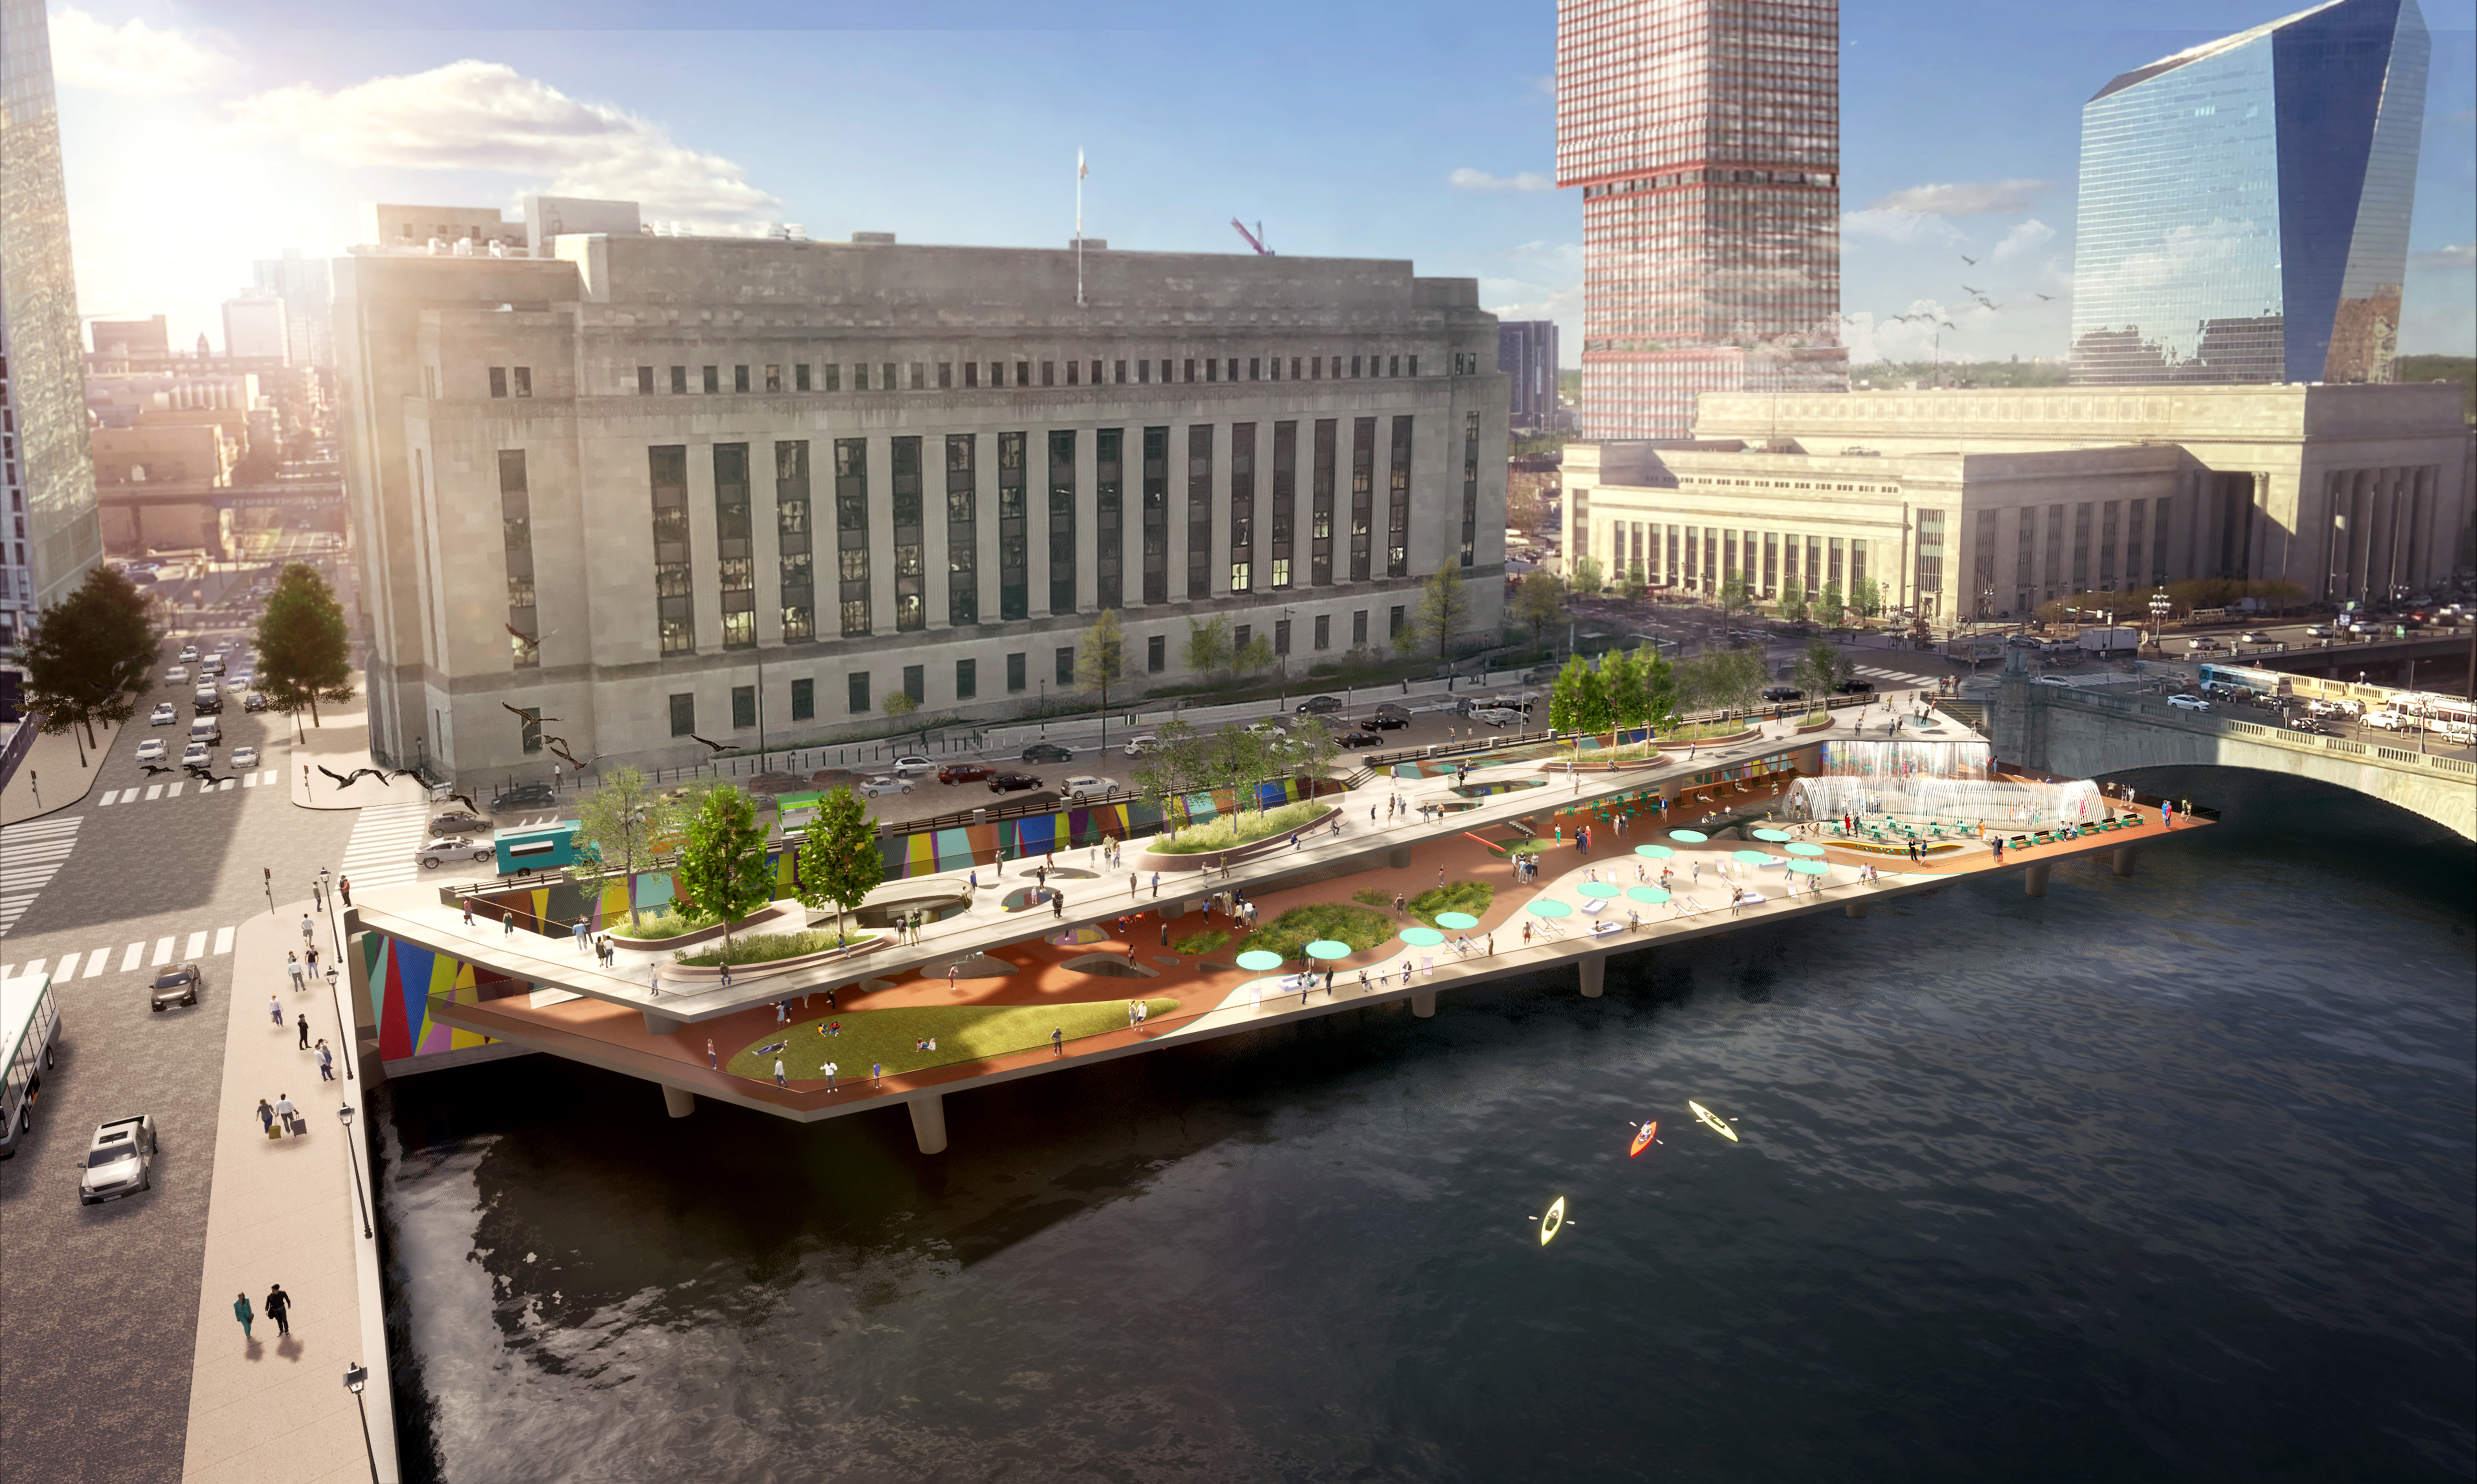
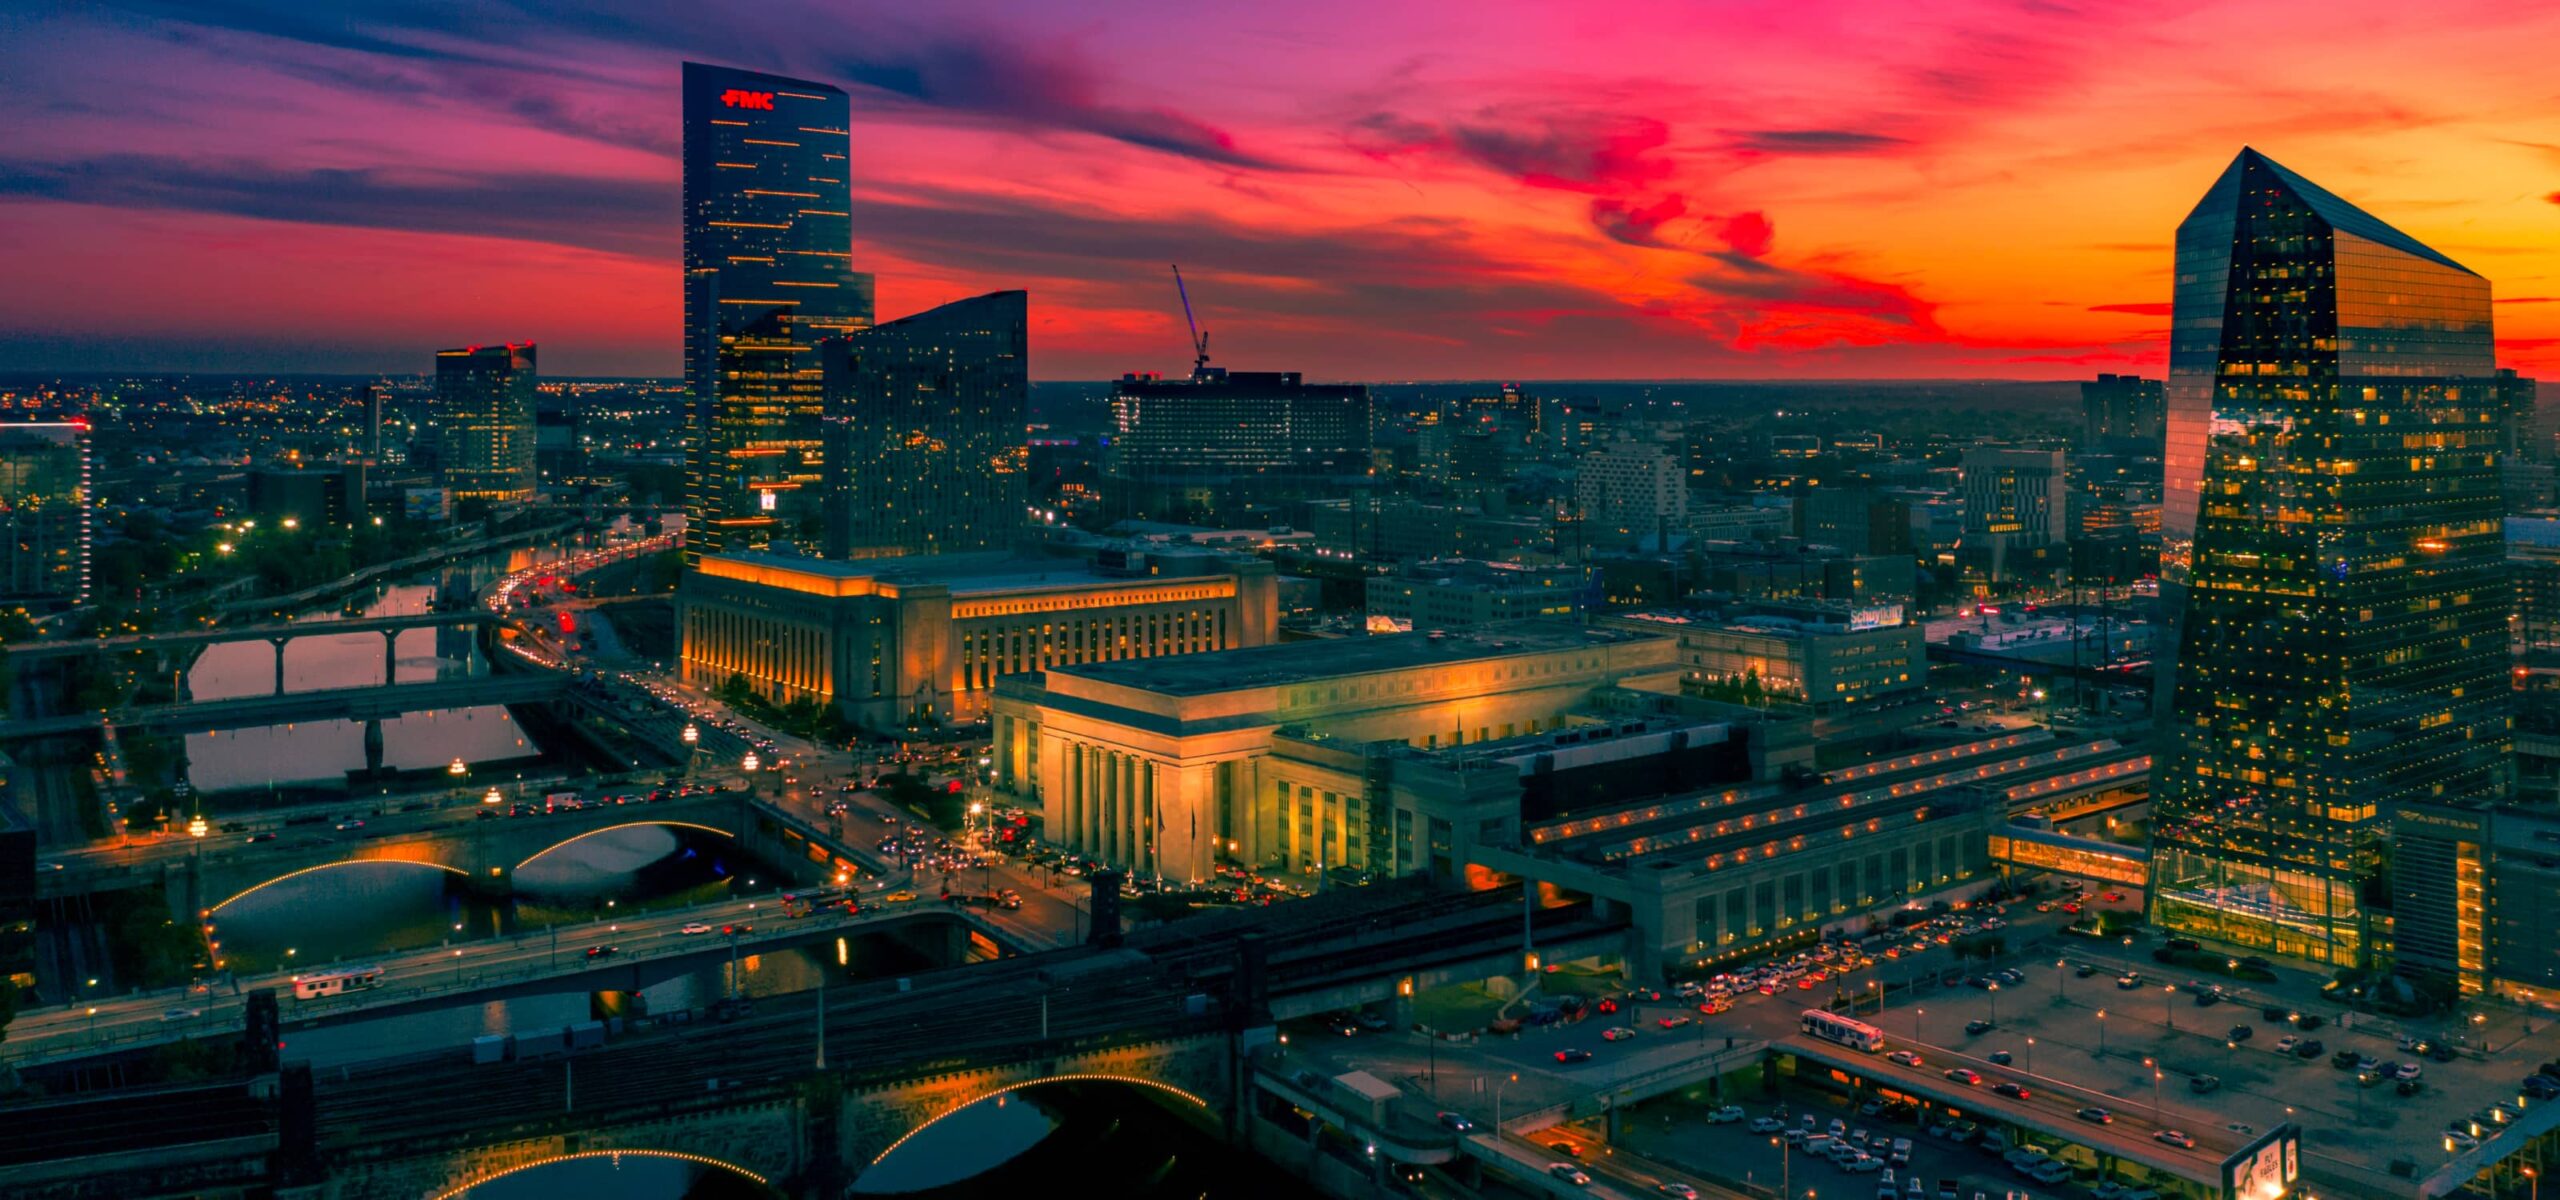
What is University City?University City is Philadelphia’s academic heart, a hub for innovation & scientific discovery, and a historic neighborhood full of artistic & cultural exploration.
- Doing Business
Learn how we promote growth and innovation, and how you can too.-
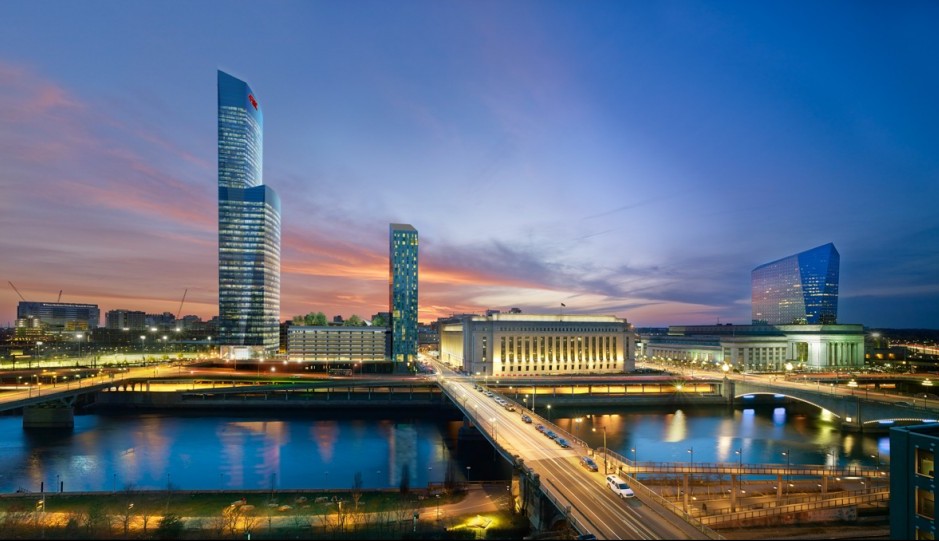
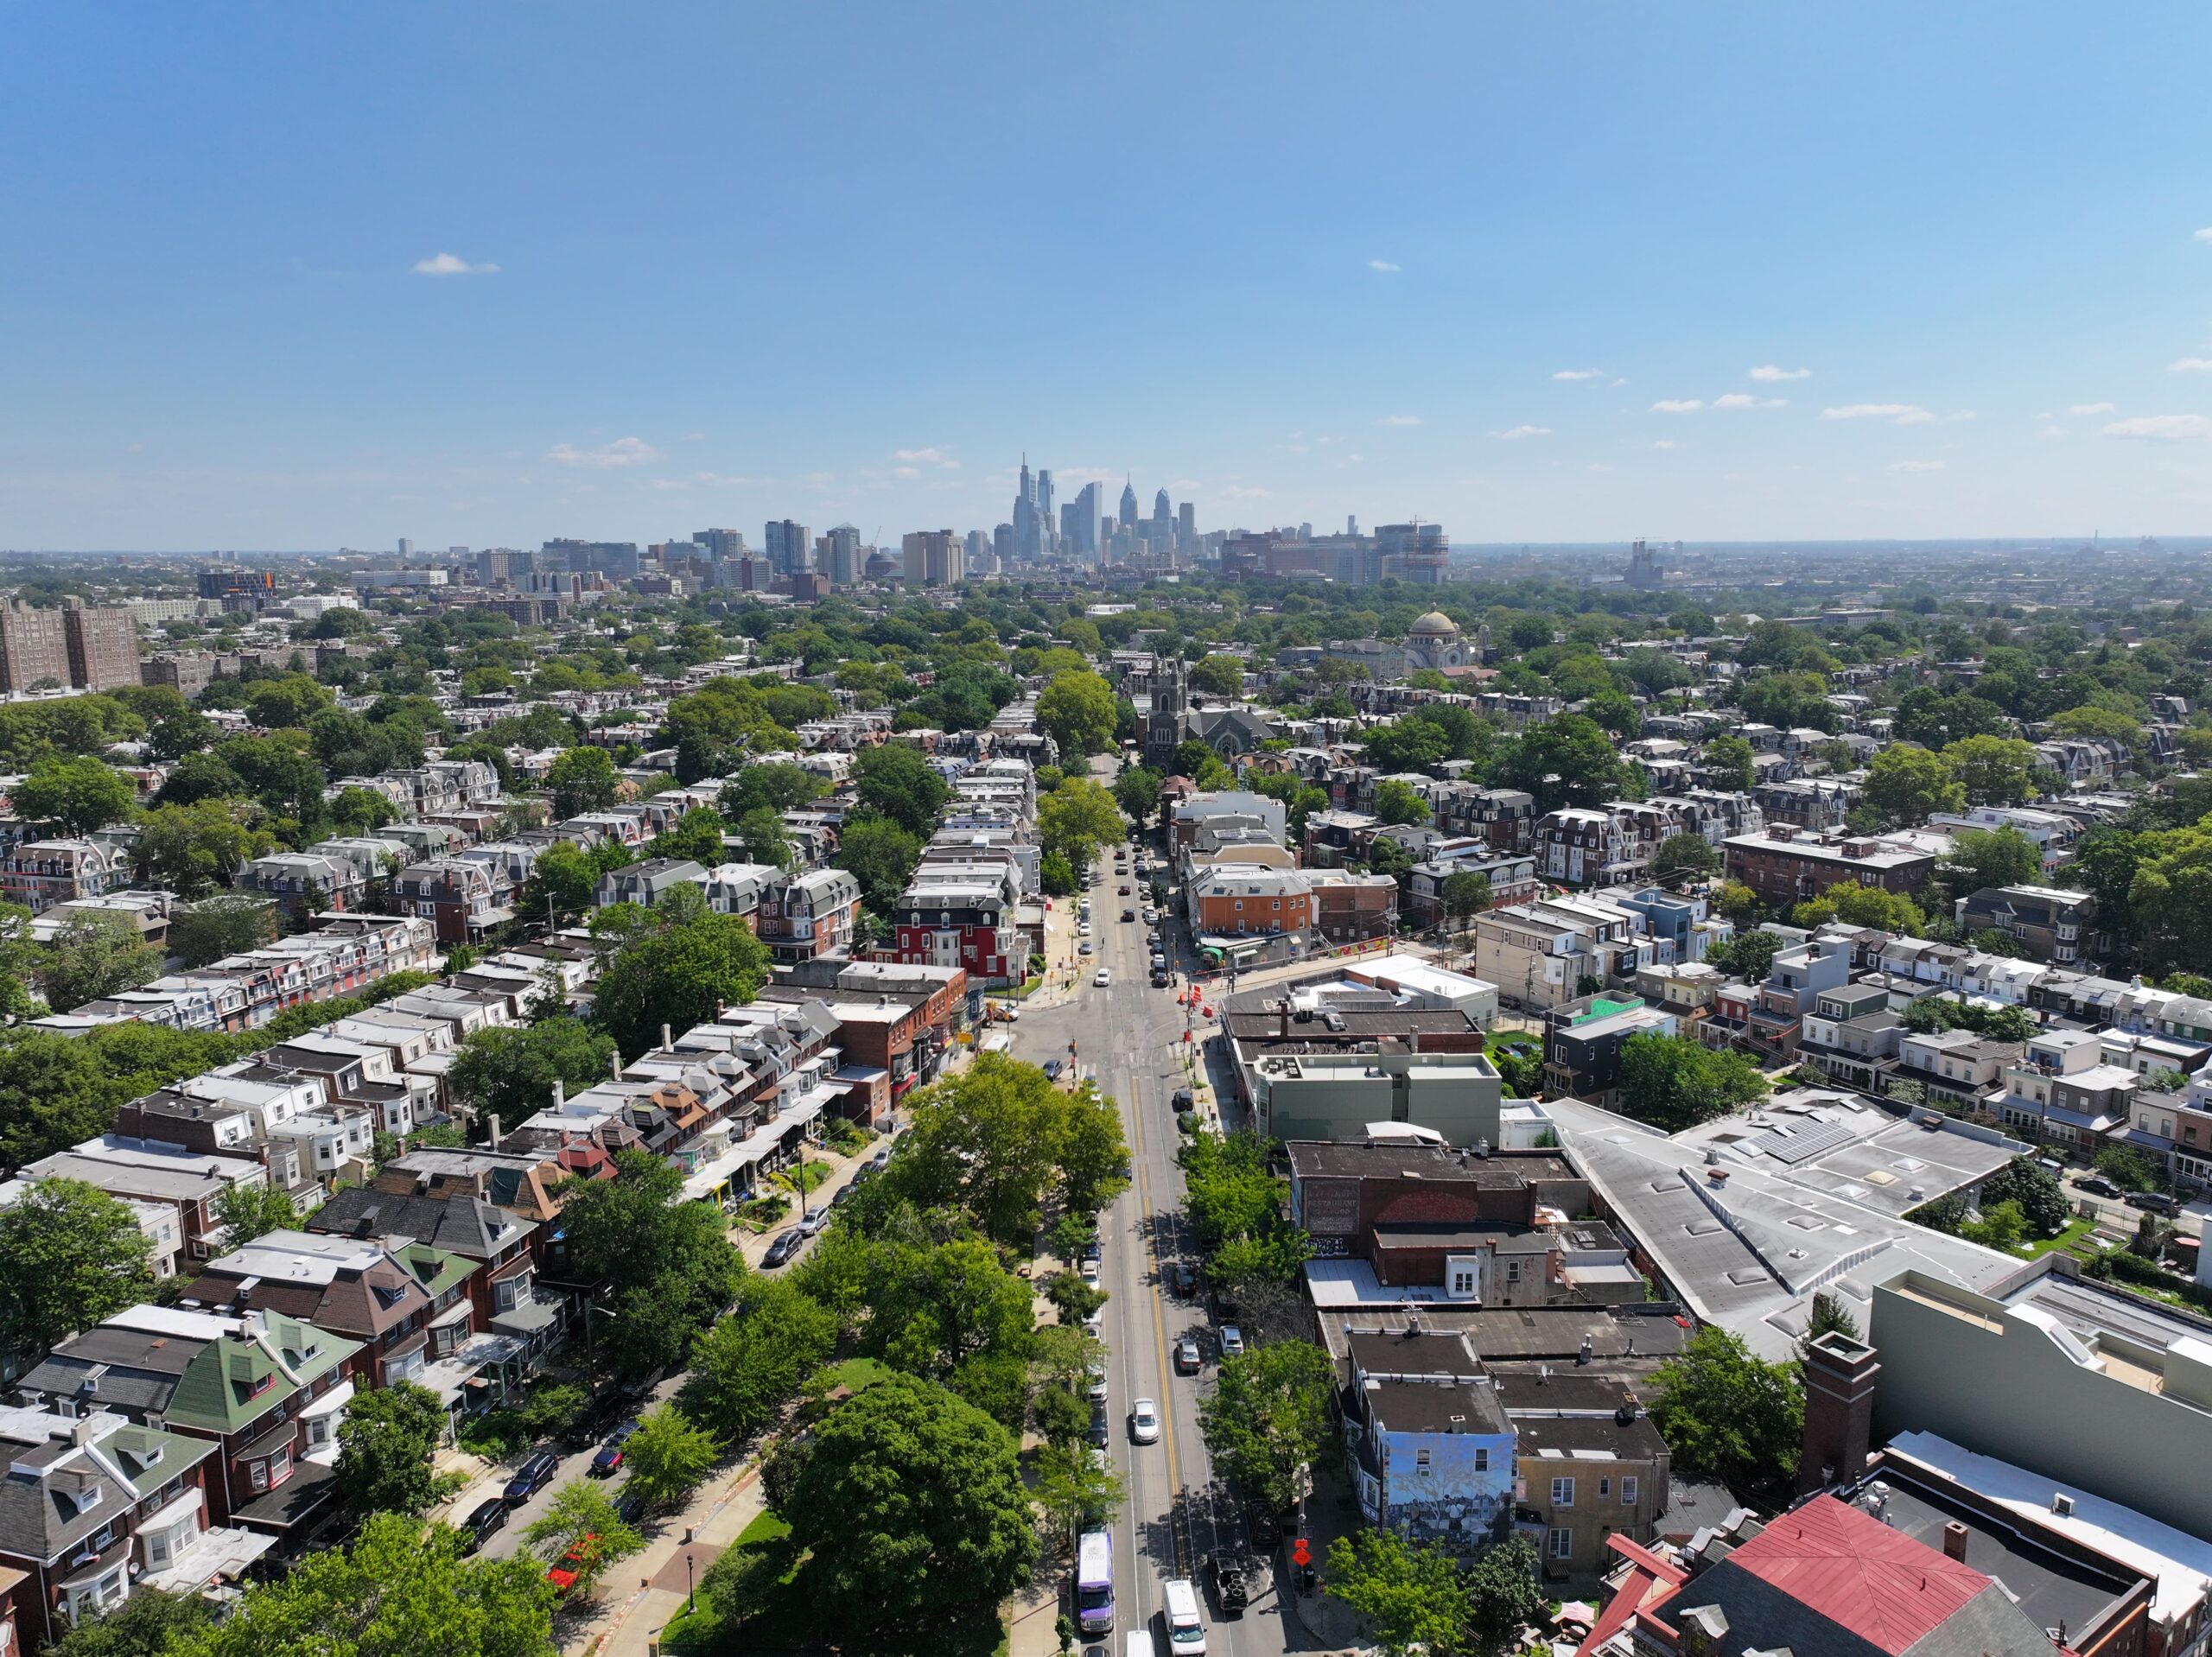
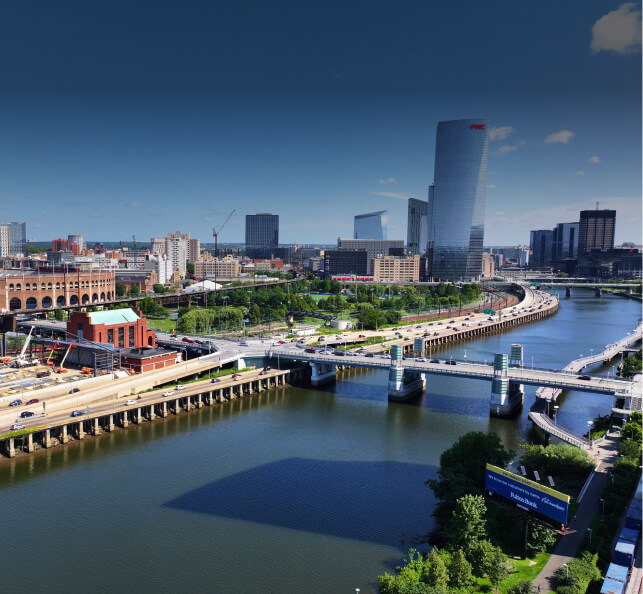 Choose University CityUniversity City is a top Philadelphia neighborhood to work, live, attend school, open a business, or visit.
 -
Reports and DataResearch & analysis tied to the local economy, transportation, public space use, public safety, workforce development, & more.
-
 Become a SponsorSponsorships provide valuable visibility while fostering community engagement, and enhancing the vibrancy of the neighborhood.
- What We Do
Explore our range of services and specialties.-
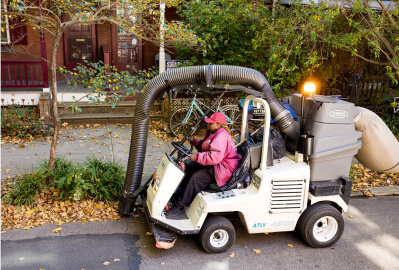 Maintain Clean and Safe StreetsCreating a safe and welcoming environment for residents, employees, students, and visitors
 -
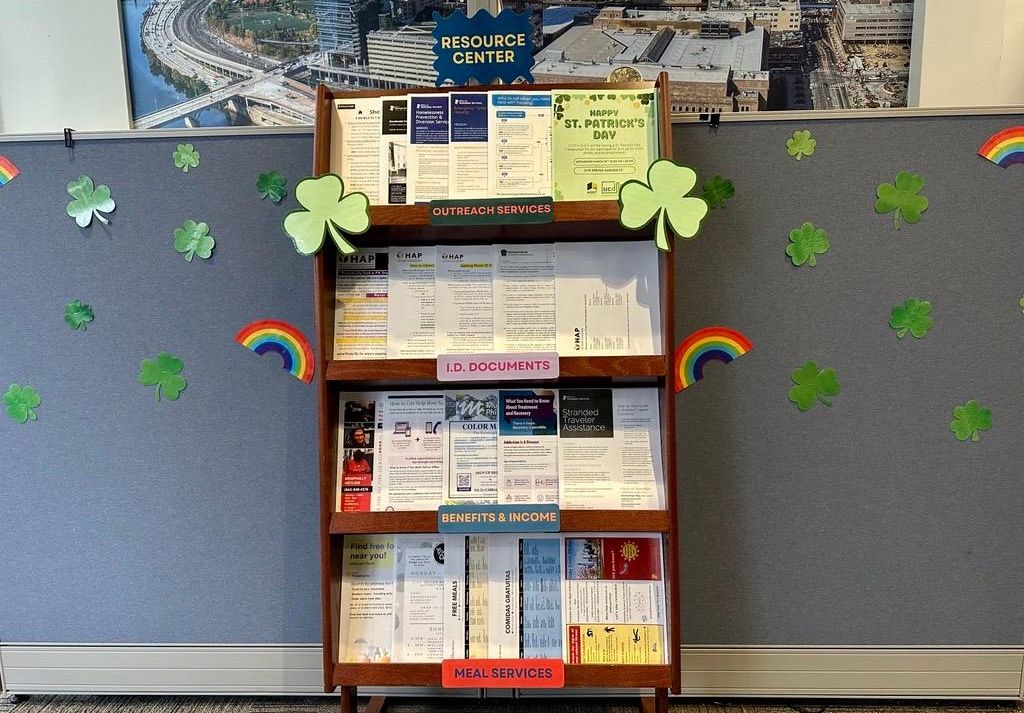
 Assist the UnhousedAddressing homelessness through a compassionate, people-first approach
 -
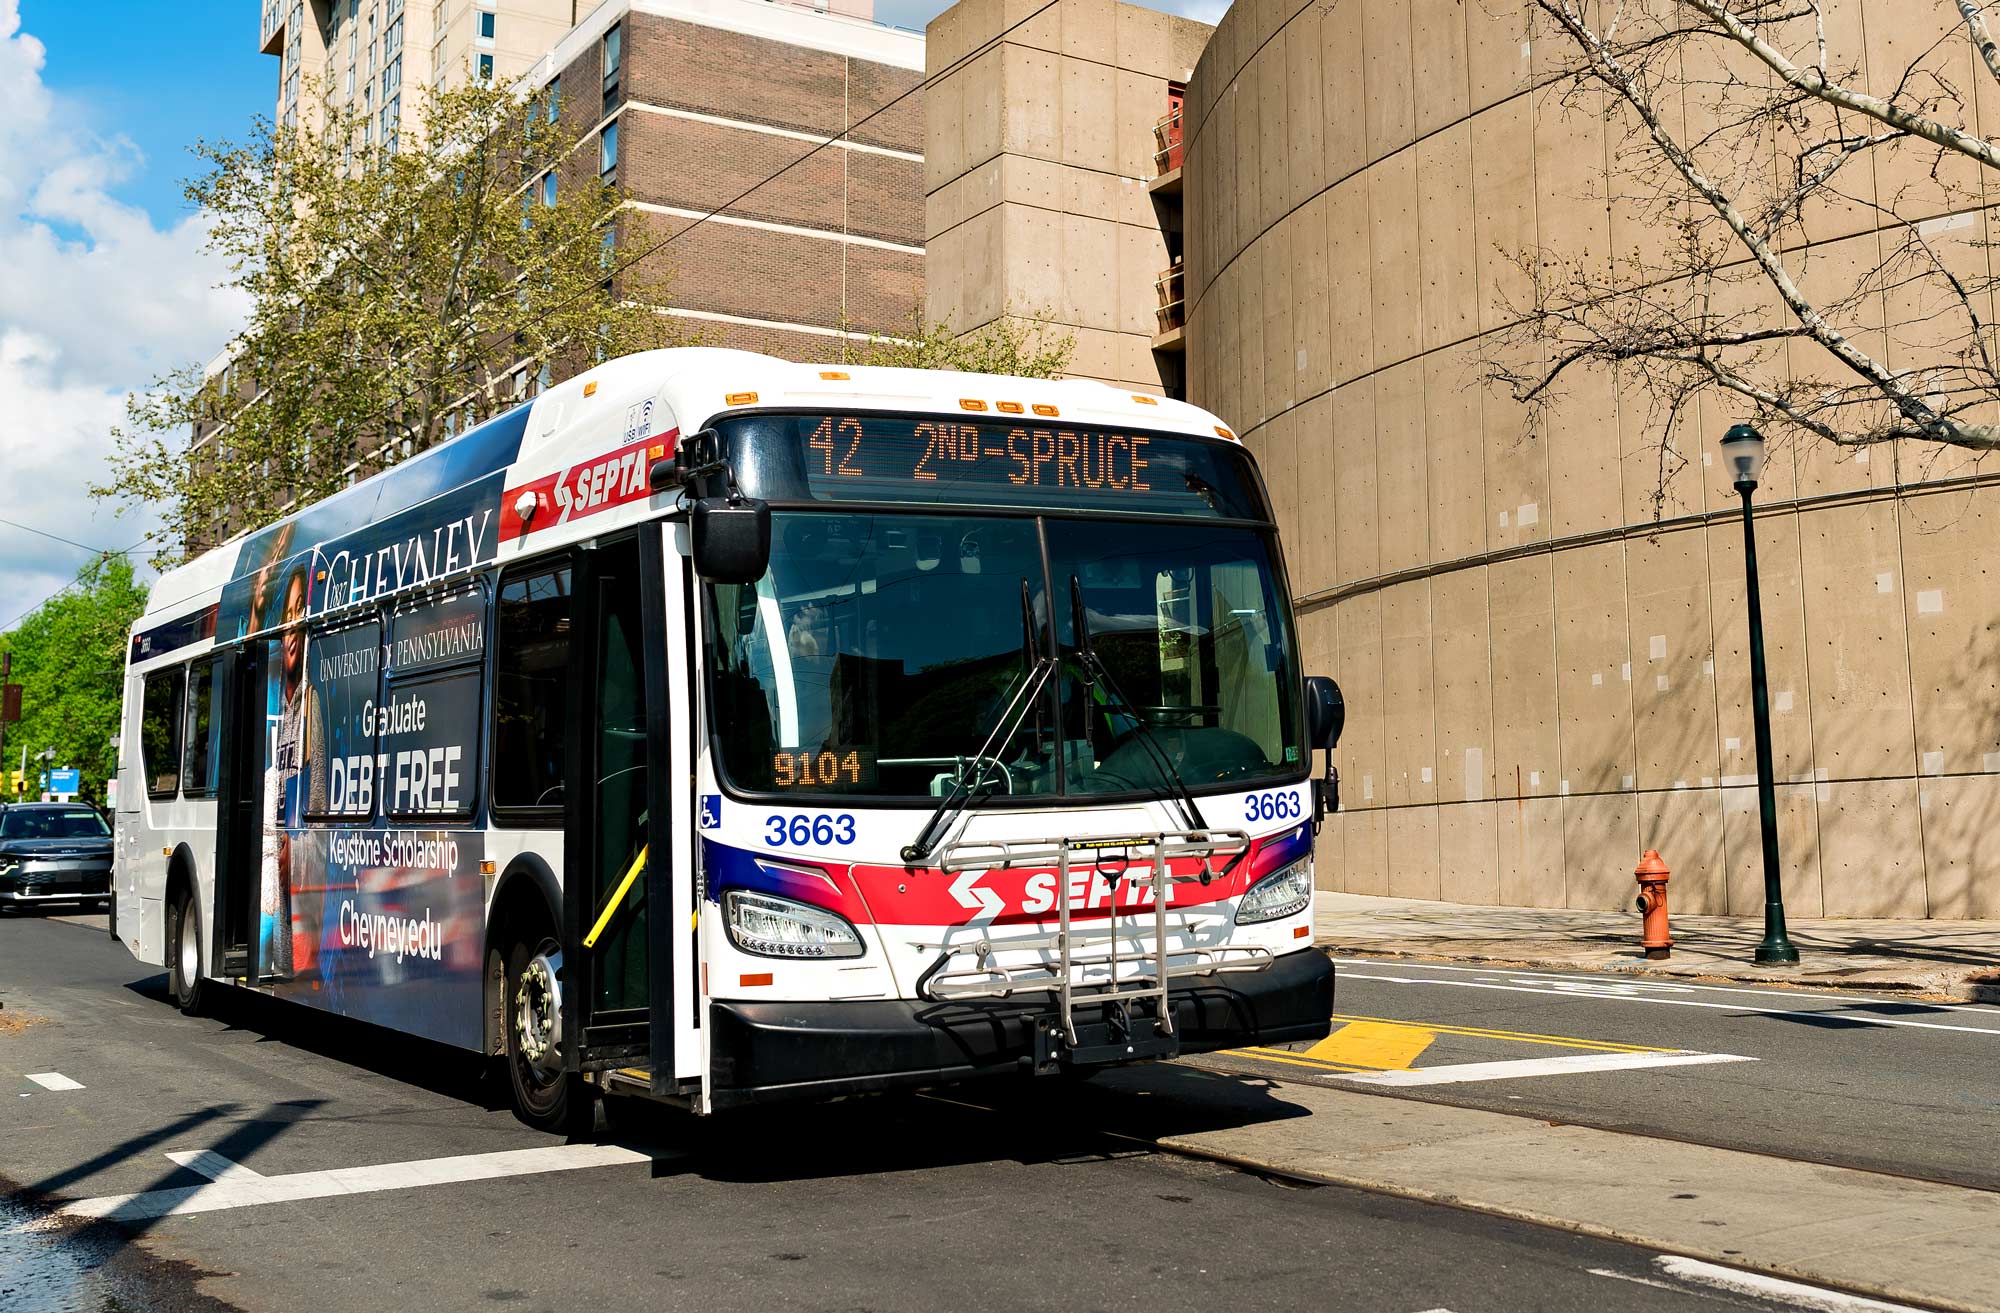
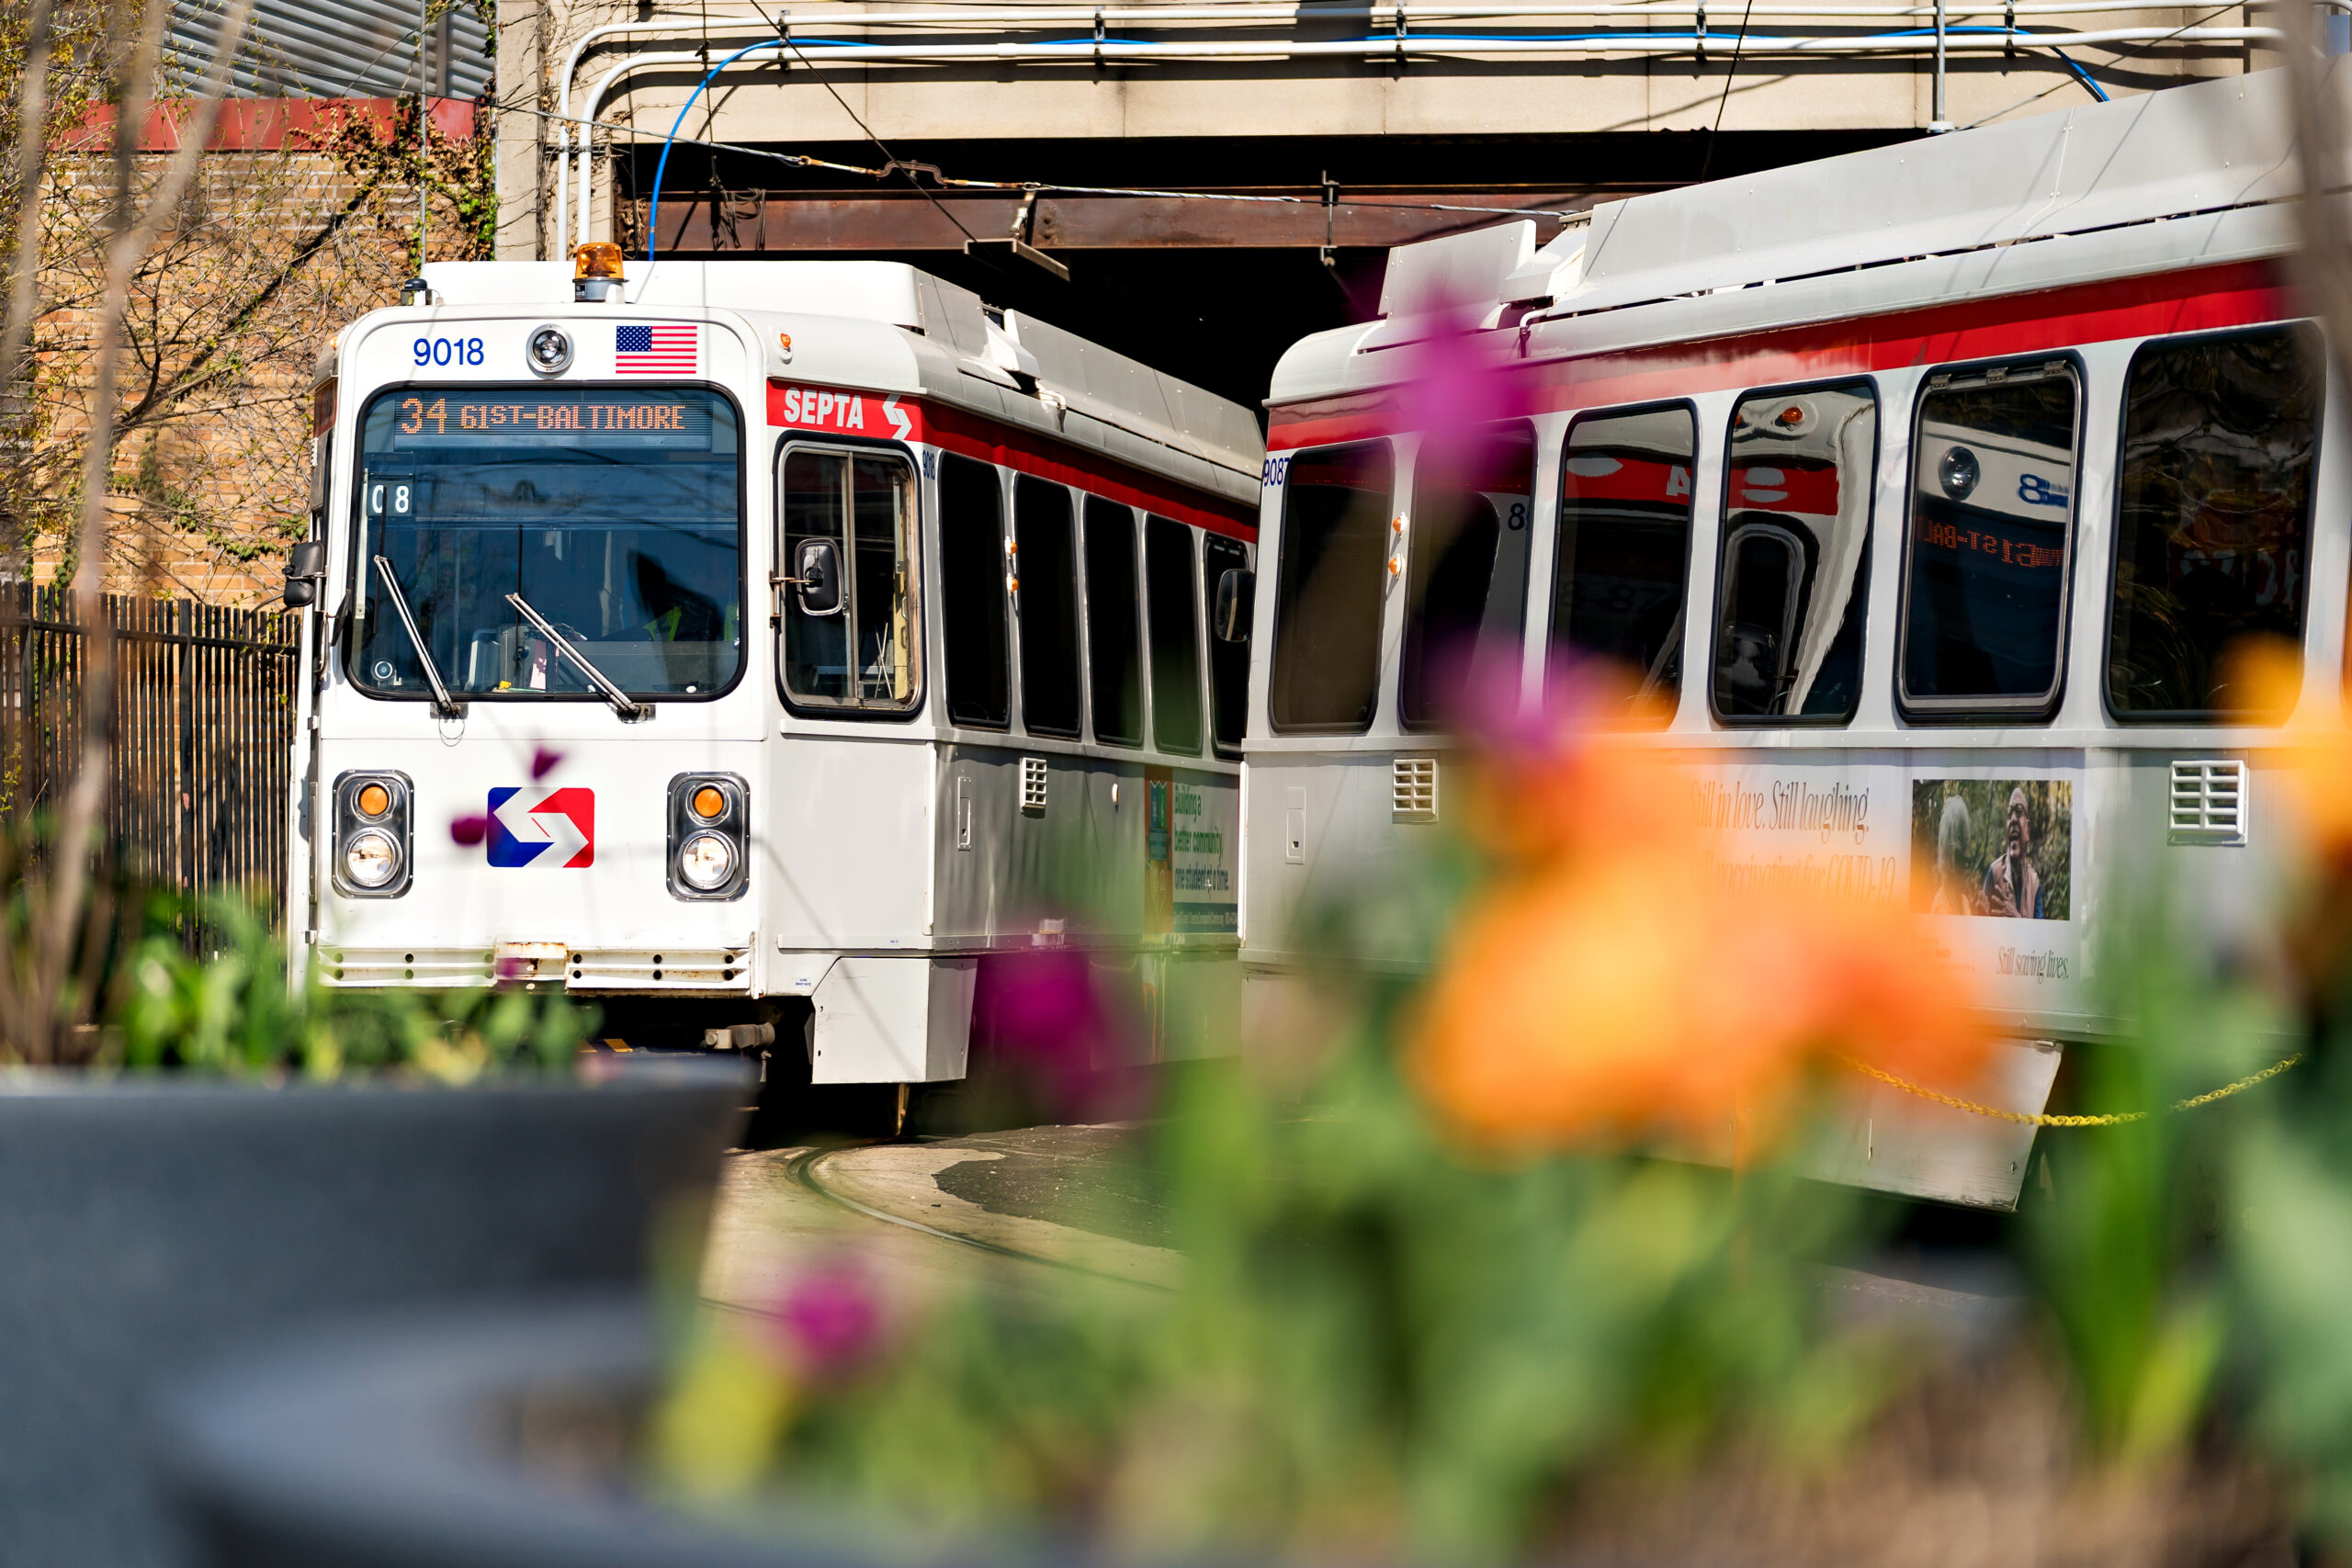
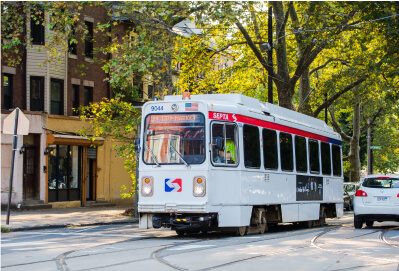 Improve TransportationAddressing bike & pedestrian safety, traffic congestion & public transit routing
 -
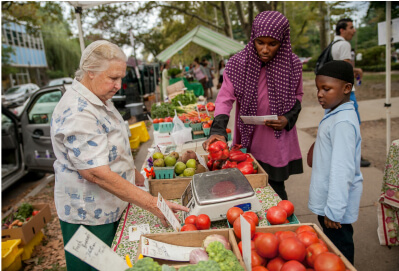 Support Our Local EconomySupporting the local business community and residents through a wide range of services
 -
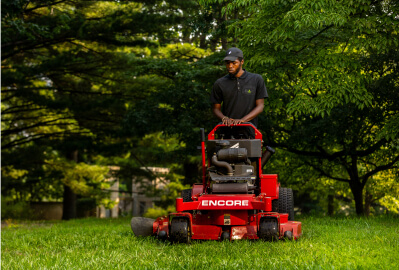 Provide Landscape ServicesOur landscaping social venture provides design-build-maintenance services
 -
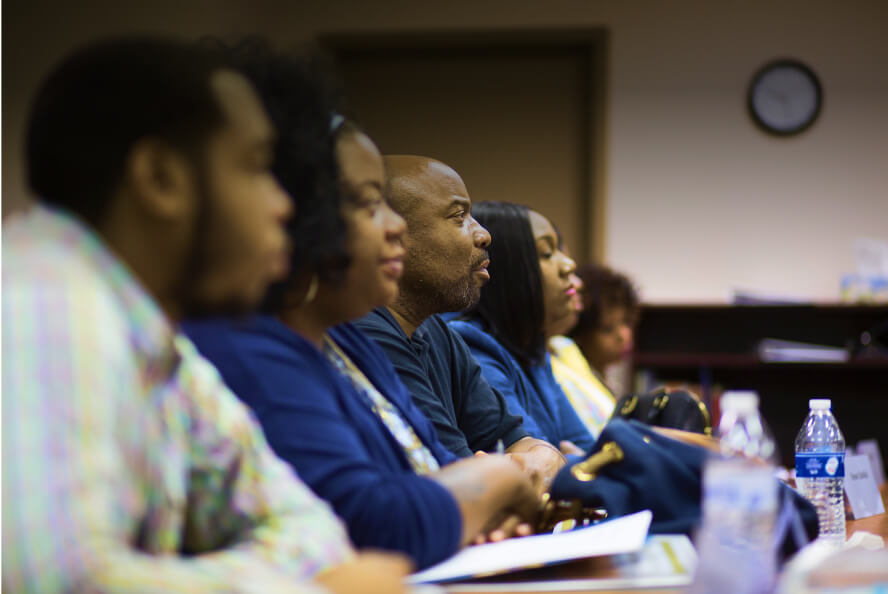
 Connect Residents to CareersHarnessing the hiring power of our area’s major employers while cultivating local talent
-